36. Reports » Tools » Packets
The Reports » Tools panel lists Packets only if there is at least one Packet Sensor or Packet Filter in use. The panel also displays how many packet dumps are active.
In this tab, you can capture packets and view dumps captured manually by Console users or automatically via a Response. Console includes an integrated packet analyzer similar to Wireshark, allowing you to inspect traffic details within the web interface.
The analyzer window shows the decoded packet list (№, Time, Source, Destination, Protocol, Size, Details), with a protocol tree and a hex view of the selected packet below. A Packet Filtering Expression field narrows down the packet list, and the Resolver selector controls name resolution.
36.1. Active Packet Captures
When there is at least one packet dump active, the following table is displayed in the content area:
● Status – Shows the capture’s running state: green if running properly, a loading indicator if queued, red if stopped or not running● Packet Logger – Indicates which Packet Sensor or Packet Filter is capturing packets● Packets / Dropped – Counts how many packets were captured and how many were dropped● Files / Size – Number of dump files generated and the size of the latest dump file● Description [BPF] – The description plus the BPF expression used for this dump● From – Start time of the capture● Until – Time limit or conditions to stop the capture process● Sampling – Which sampling type was used● Payload – Reflects the Packet Payload parameter● Comments – Shows any Comments entered for this dump● Actions• View the latest dump file in the integrated analyzer• Download the latest dump file. If it fails but View works, increase max_execution_time and memory_limit in php.ini• Stop the capture process
The [Batch] button provides a Stop action that stops all packet dumps at once.
36.1.1. New Packet Capture
Administrators, Operators, and guests with packet capturing privileges can generate packet dumps by clicking the [Capture Packets] button.
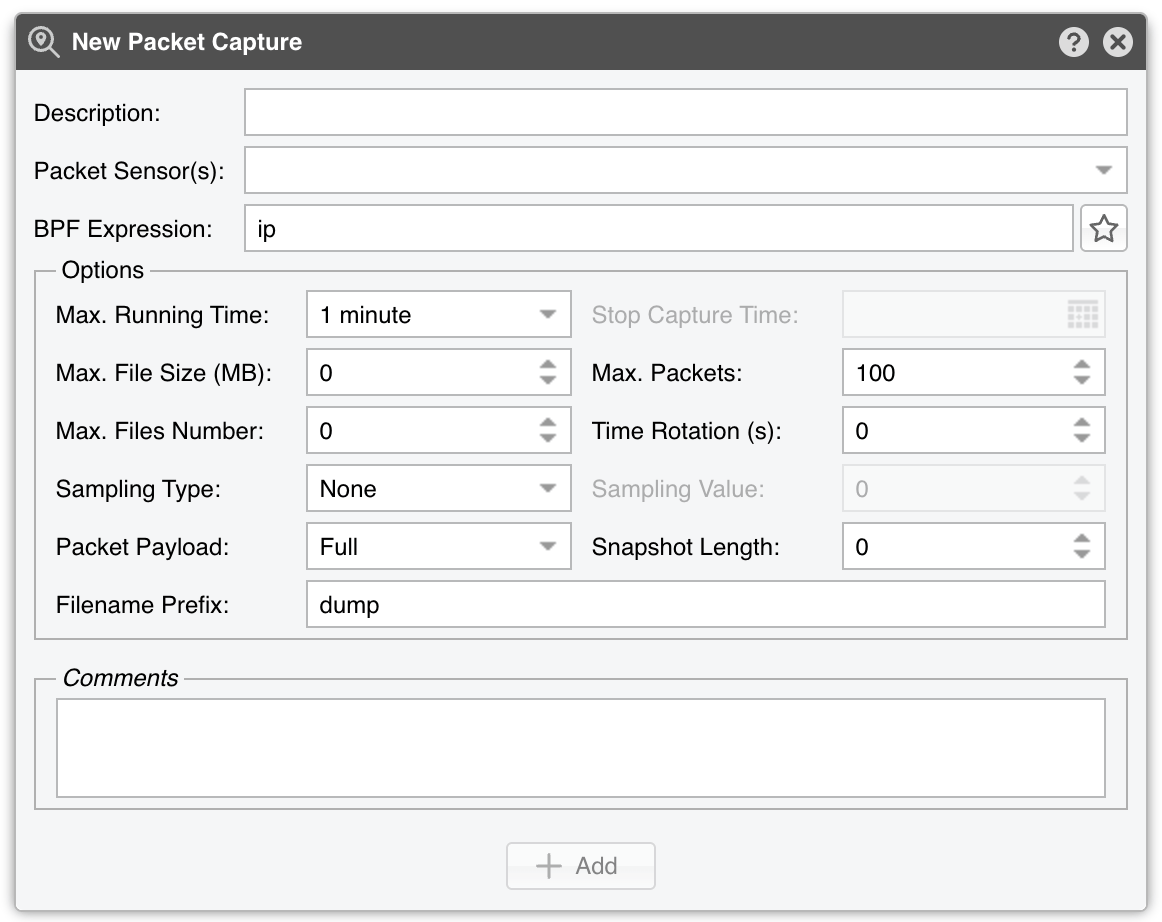
New Packet Capture parameters:
● Description – (Optional) A short label to identify the packet dump● Packet Sensor(s) – Choose one or more Packet Sensors to capture packets. Guest accounts may see only certain Sensors● BPF Expression – Required. For all IP packets, enter “ip”. Click the star icon to view BPF (Berkeley Packet Filter) syntax. Save commonly used expressions for reuse● Max. Running Time – The maximum duration for the capturing thread● Stop Capture Time – If Max. Running Time is Unlimited, specify a date/time for the capture to end● Max. File Size (MB) – Splits dumps into multiple files of <size> MBytes. Once a file exceeds <size>, Packet Sensor closes it and starts a new file● Max. Packets – Stops capturing after <number> packets● Max. Files Number – Limits the total number of dump files to <number>; older files are overwritten, creating a rotating buffer. File names use leading zeros, ensuring correct sorting● Time Rotation (s) – If set, creates a new file every <number> seconds● Sampling Type & Value – Select None to capture all packets. Select 1 / Value to save 1 out of every <value> packets. Select Value / 5s to save up to <value> packets every 5 seconds● Packet Payload – Select Full to capture the entire packet. Select Only Layer 3 to zero out the payload, retaining only the IP header. Select Only Layer 4 to retain TCP/UDP/ICMP headers, discarding other payload data● Snapshot Length – Sniff <number> bytes per packet. The default 0 captures full packets (displayed as ∞ in the archive). Larger snapshots increase CPU load and reduce packet buffering, risking drops. Use the smallest snapshot length that still captures the protocol details you need● Filename Prefix – Name of the output file. If rotation is enabled, a numeric suffix is appended● Comments – (Optional) Notes or remarks about the packet dump
36.2. Packet Dump Archive
By default, the records are sorted by time in descending order. By clicking the down arrow of any column header, you can apply row filters, change sorting direction, and toggle columns’ visibility. The top bar provides a Row Filtering Expression search field, a Display selector (Compact, Extended, Full), an Export panel, and a Refresh bar.
Note
If the packet dumps are not visible and the Packet Sensor / Packet Filter is running on a different server than the Console, follow the NFS shares configuration steps.