8. General Settings » Graphs & Storage
In a later chapter, you will see how to configure Sensors to generate traffic graphs, top statistics, and accounting information for every IP in the monitored network. In Configuration » General Settings » Graphs & Storage, you can configure how much disk space will be used to store that data, as well as other storage-related settings.
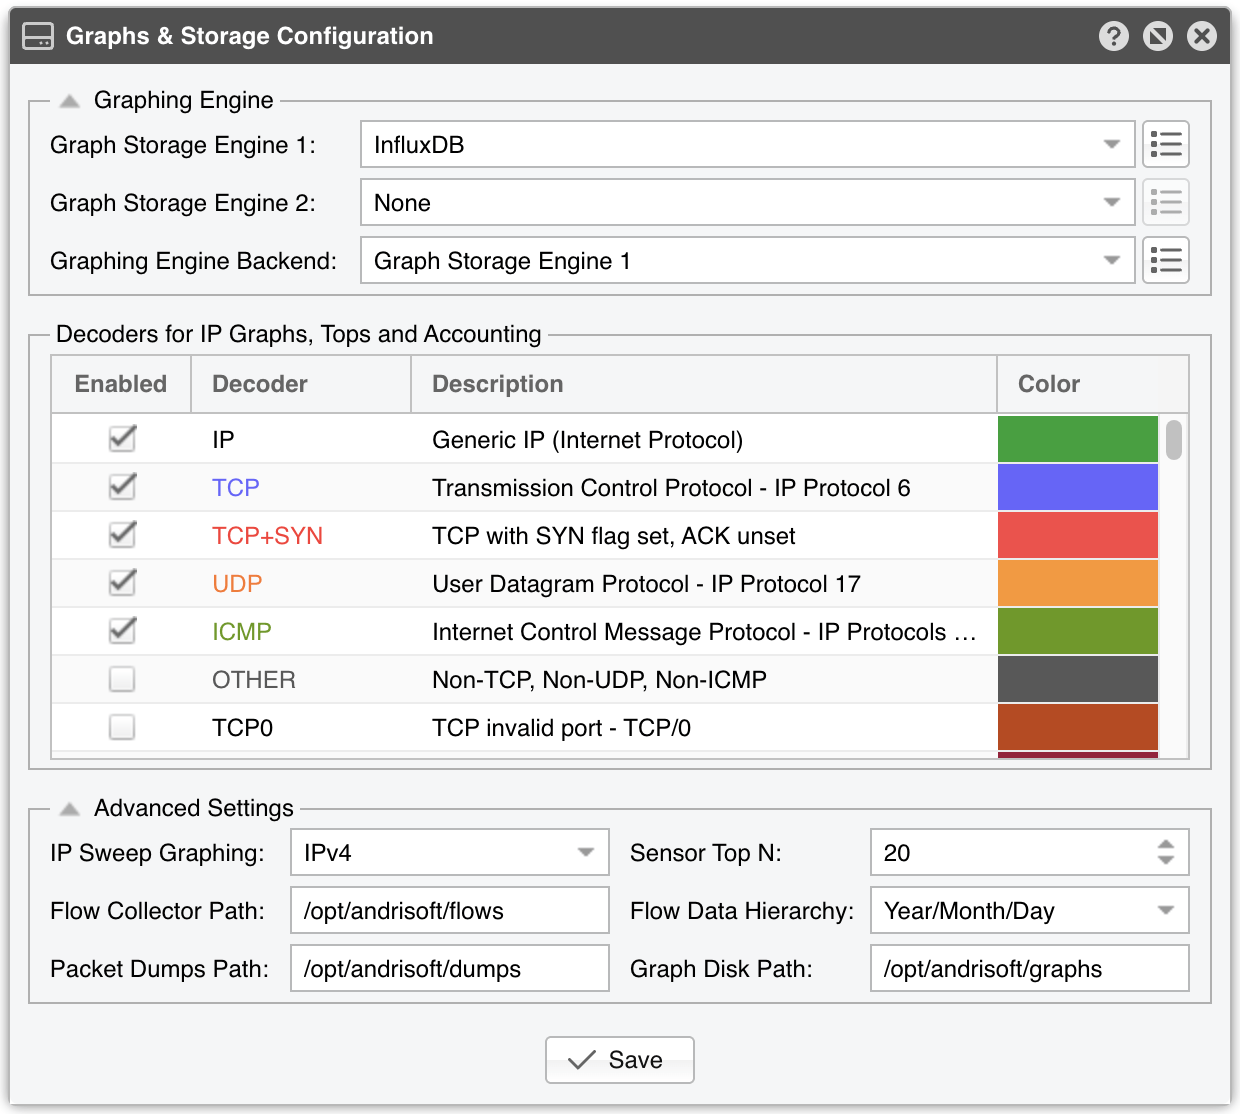
The panel is divided into three sections: Graphing Engine, which selects the storage backends and the way graphs are rendered; Decoders for IP Graphs, Tops and Accounting, which selects the traffic dissectors whose data is stored; and Advanced Settings, a fieldset that is collapsed by default and holds the storage paths and a few tuning parameters.
The Graph Storage Engine parameters let you select the third-party software used to store graph data:
► InfluxDB is a specialized database designed for time series data. It uses more RAM than RRDTool but requires less storage space, is faster in most cases, can be configured for High Availability, and does not delete existing data when you change the configuration► ClickHouse is a fast, column-oriented analytics database. It offers the query speed and low storage requirements of InfluxDB while avoiding its cardinality-related scaling issues, so RAM usage stays predictable even when graphing a very large number of IPs or ASNs► RRDTool is a very stable and old solution for time series data. However, it can be slow in some cases (due to disk seek times), uses more storage space (due to pre-allocation of data), and some configuration changes (e.g., adding a decoder) reset existing graph data
Graph Storage Engine 1 is the primary backend. It can be set to InfluxDB, ClickHouse, RRDTool (On Disk), or RRDTool (In RAM), and by default it is the only backend in use.
Graph Storage Engine 2 is optional. It defaults to None and can be set only to InfluxDB or ClickHouse — RRDTool cannot be used as a secondary backend. When enabled, it stores the same graph data in a second backend simultaneously, for redundancy or for switching backends without a gap in new data. Data already stored in a backend is not copied to the other one.
InfluxDB is the fastest graph storage engine in most situations. When the IP graph data has a very high cardinality, the recommended setup keeps InfluxDB as Graph Storage Engine 1 and adds ClickHouse as Graph Storage Engine 2 for the IP and optionally the AS graphs, using the Storage Restrictions parameter of each engine to split the graph classes between them.
Click the Options button on the right-hand side to configure the selected Graph Storage Engine:
InfluxDB 1.x is the fastest graph storage engine, but its RAM usage grows with very big series cardinality (>1M).
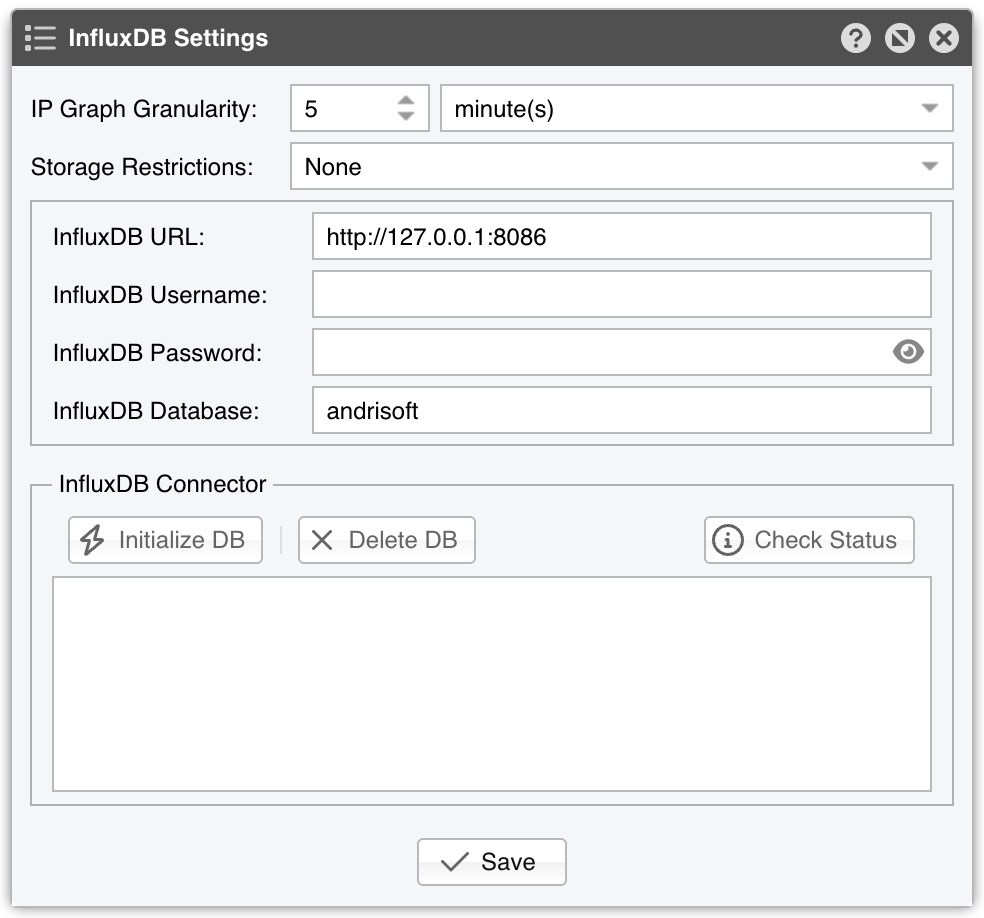
http://127.0.0.1:8086ClickHouse is not constrained by series cardinality, which makes it the most scalable option for IP, AS, and Country graphs.
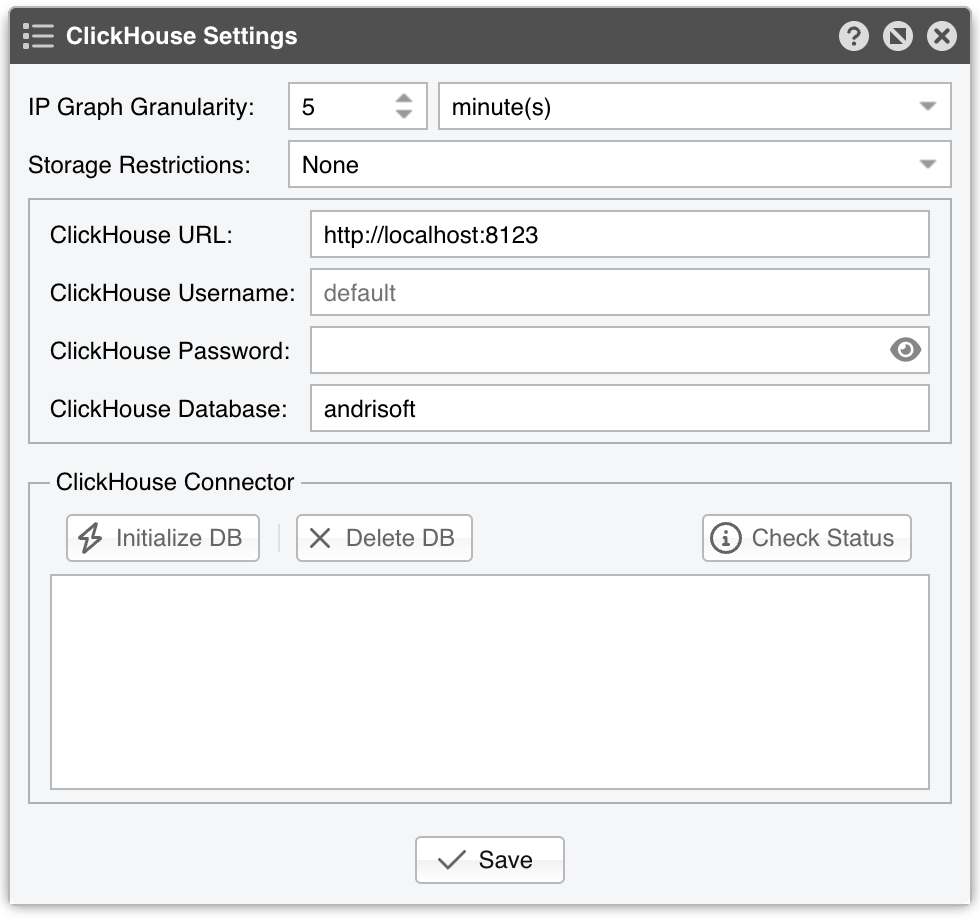
http://localhost:8123ClickHouse Installation
ClickHouse can run on the Console server or on a separate server reachable over HTTP(S). Install the production ClickHouse server from the official repository (for other platforms and installation methods, see the ClickHouse installation documentation):
[root@console ~]# apt-get install -y apt-transport-https ca-certificates curl gnupg
[root@console ~]# curl -fsSL 'https://packages.clickhouse.com/rpm/lts/repodata/repomd.xml.key' | gpg --dearmor -o /usr/share/keyrings/clickhouse-keyring.gpg
[root@console ~]# echo "deb [signed-by=/usr/share/keyrings/clickhouse-keyring.gpg arch=$(dpkg --print-architecture)] https://packages.clickhouse.com/deb stable main" | tee /etc/apt/sources.list.d/clickhouse.list
[root@console ~]# apt-get update
[root@console ~]# apt-get install -y clickhouse-server clickhouse-client
[root@console ~]# systemctl enable --now clickhouse-server
During installation, the clickhouse-server package asks for an optional password for the built-in default user; leaving it empty keeps the user password-less.
[root@console ~]# yum install -y yum-utils
[root@console ~]# yum-config-manager --add-repo https://packages.clickhouse.com/rpm/clickhouse.repo
[root@console ~]# yum install -y clickhouse-server clickhouse-client
[root@console ~]# systemctl enable --now clickhouse-server
Instead of using the built-in default user, you can create a dedicated user for the Console by adding an XML file to the /etc/clickhouse-server/users.d/ directory. First, generate a password together with its SHA-256 hash:
[root@console ~]# PASSWORD=$(base64 < /dev/urandom | head -c12); echo "$PASSWORD"; echo -n "$PASSWORD" | sha256sum | tr -d '-'
Then create /etc/clickhouse-server/users.d/andrisoft.xml with the username as the element name and the hash inside it — a plaintext <password> element also works but is not recommended. All available options are documented in /etc/clickhouse-server/users.xml:
<clickhouse>
    <users>
        <andrisoft>
            <password_sha256_hex>paste the SHA-256 hash here</password_sha256_hex>
            <networks>
                <ip>127.0.0.1</ip>
                <ip>::1</ip>
            </networks>
            <profile>default</profile>
            <quota>default</quota>
        </andrisoft>
    </users>
</clickhouse>
The <networks> element restricts where the user can connect from. Keep it as above when ClickHouse runs on the Console server, or list the IP addresses of the connecting servers otherwise. ClickHouse applies the files in users.d/ automatically, without a restart. Enter the new username and password in the fields described above, then press [Initialize DB].
This method optimizes the long-term storage of IP graph data by allowing up to three Round Robin Archives.
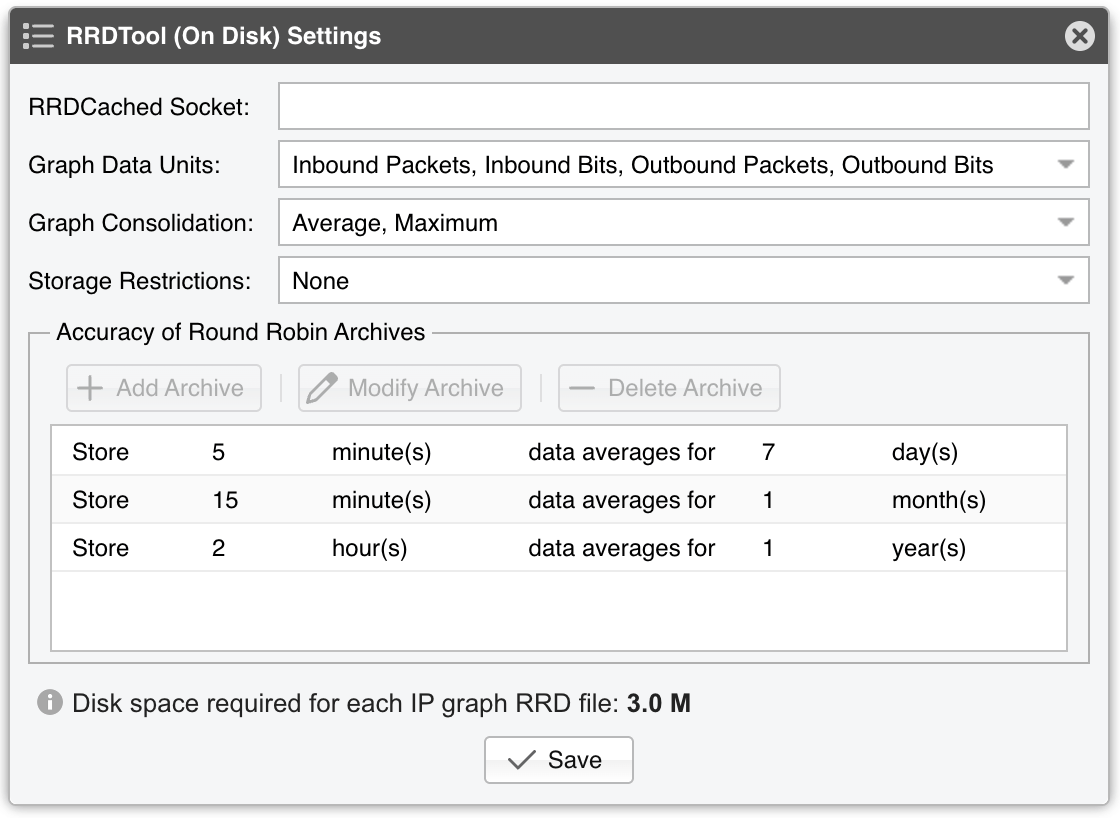
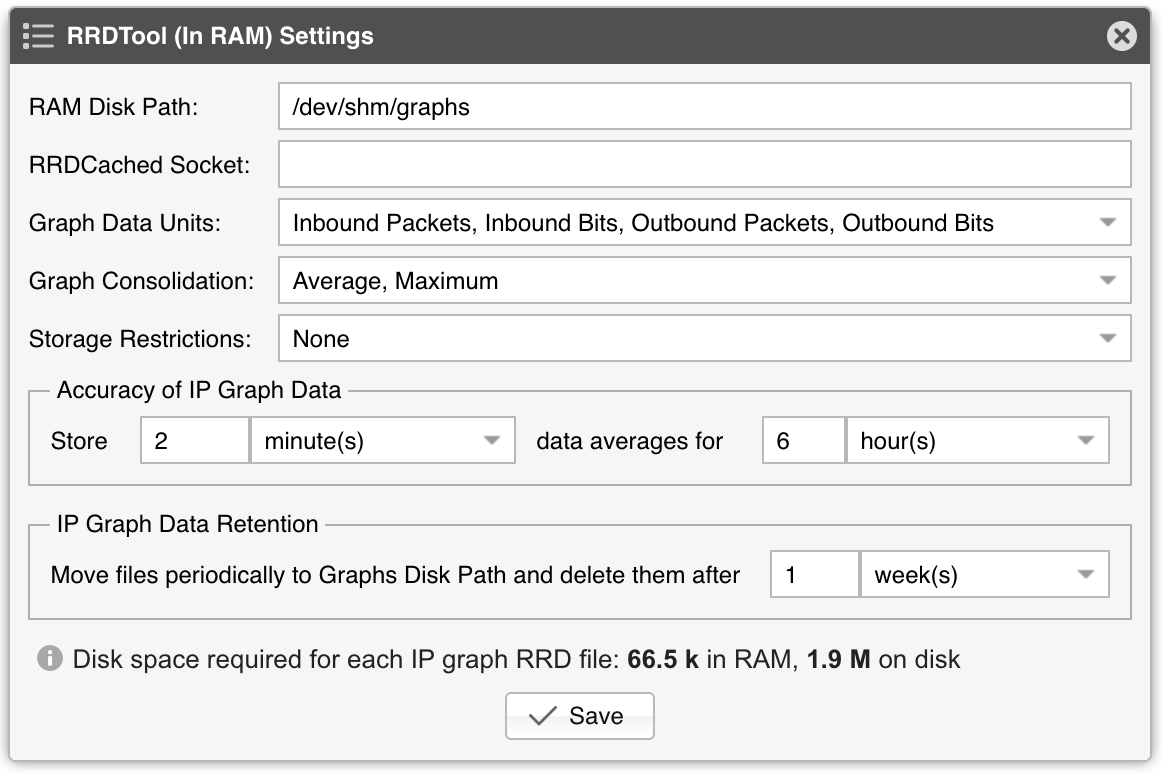
This method is not optimal for long-term storage because it allows a single Round Robin Archive per IP graph file. Select this method when you can’t use InfluxDB or ClickHouse and when the previous method (configured with RRDCached) is not fast enough to sustain updating thousands of very high-granularity IP graphs.
Graphing Engine Backend lets you choose from which Graph Storage Engine to retrieve data when rendering graphs — either Graph Storage Engine 1 or Graph Storage Engine 2. The Options button lets you select the Graph Rendering method:
► Native (Javascript) renders graphs and charts directly in the browser, enabling click-to-zoom, animations, and rich tooltips► PNG (High DPI), PNG (Low DPI), and SVG render static images on the Console server. On macOS or Linux, you may need to install the Consolas font to properly display SVG files
Decoders are internal functions (traffic dissectors) that identify and classify the underlying protocols of each packet or flow. Each enabled decoder increases the size of IP graphs, tops, and accounting data, and introduces a small performance penalty, so enable only the decoders you actually need. You can use the existing built-in decoders or you can create custom decoders under General Settings » Custom Decoders.
The Decoders for IP Graphs, Tops and Accounting grid has four columns:
● Enabled – Select the checkbox to store the decoder’s data in IP graphs, tops, and accounting data● Decoder – The name of the traffic dissector● Description – A short explanation of what the decoder matches● Color – The color used for the decoder in graphs. Click the cell to pick a new color
The remaining parameters are located in the Advanced Settings fieldset, which is collapsed by default.
IP Sweep Graphing allows storing IP graph data for IPv4 and/or IPv6 addresses receiving traffic without returning any. It can be set to Off, IPv4, IPv6, or IPv4 and IPv6. Avoid setting it to Off when monitoring unidirectional links or asymmetric traffic. Enabling it for IPv6 is generally not recommended because the vast number of possible IPv6 addresses can quickly exhaust RAM (when using InfluxDB) or disk space (when using RRDTool or ClickHouse).
Sensor Top N (default: 20, minimum 5, maximum 2048) specifies the maximum number of items stored for each ordered data set, such as top talkers, external IPs, ASNs, countries, TCP/UDP ports, IP protocols, etc.
Flow Sensor saves flow data on the local disk in the path defined by the Flow Collector Path, using a directory structure determined by Flow Data Hierarchy:
► Off – No directory hierarchy is created► Year/Month/Day and Year/Month/Day/Hour – Nested directories, optionally down to the hour► Year/Week/DoW and Year/Week/DoW/Hour – Nested directories by week and day of the week► Year/DoY and Year/DoY/Hour – Nested directories by day of the year► Year-Month-Day and Year-Month-Day/Hour – A single directory per day (for example, 2026-07-09) instead of nested Year, Month, and Day directories
Packet Sensor saves packet dumps in the path set by the Packet Dumps Path.
RRDTool stores all graph files on the Console server in the Graph Disk Path. InfluxDB stores graph data in /var/lib/influxdb/data/, and ClickHouse in /var/lib/clickhouse/. If you want to use another path or drive, symlink it to the original location.
Note
It is strongly recommended to automate the deletion of old data and to monitor disk usage for IP graphs in General Settings » Data Retention.
8.1. Sensor and Applications Graph Troubleshooting
8.2. IP/Subnet and Profiling Graph Troubleshooting
killall gengraph_ip and configure ClickHouse, InfluxDB, or RRDCached. When launched, the process stops only when the graph is generated. This process can be slow when users request subnet graphs for subnets not specifically defined in the IP Zone. It is not possible to throttle the number of graphs requested by users