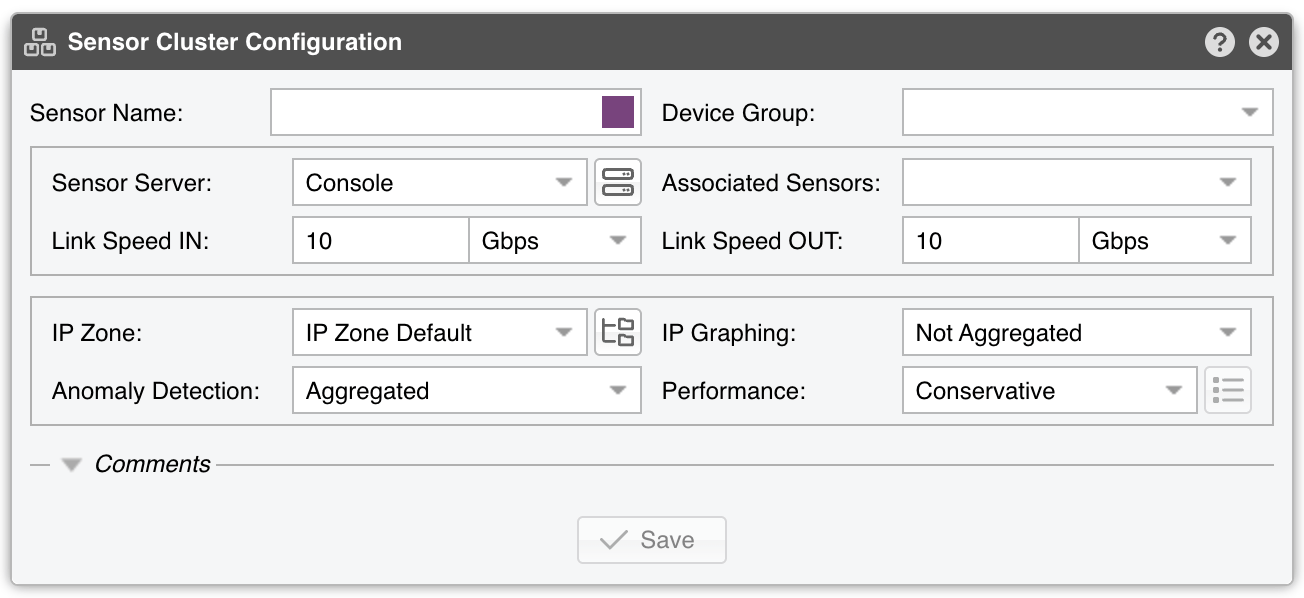
To add a Sensor Cluster, click the [+] button found on the title bar of the Configuration » Components panel. To configure an existing Sensor Cluster, go to Configuration » Components, then click its name.
● Sensor Name – A short label for easily identifying the Sensor Cluster. The colored square inside the field sets the color used in graphs for the Sensor Cluster; the default is random
●
Device Group – Enter a description if you wish to organize components (e.g., by location, characteristics) or to permit fine-grained access for
roles. The combo box is editable, so you can type a new group instead of selecting an existing one
●
Sensor Server – Select a
server that meets the
minimum system requirements for running the Sensor Cluster. The button on the right opens the configuration of the selected server
● Associated Sensors – Choose which Packet Sensors and Flow Sensor interfaces you want the Sensor Cluster to aggregate. Sensor Clusters themselves are never listed, so they cannot be nested. The drop-down carries a search box that filters the list as you type, a Select All checkbox that picks every entry the filter leaves visible and clears them again when unticked, and a Selected: n/m counter
● Link Speed IN / OUT – Enter the combined bandwidth or capacity of the aggregated interfaces. These values are used for percentage-based reports and bits/s thresholds
●
IP Zone – Sensor Cluster uses the
IP Zone to determine network boundaries and apply per-subnet settings. The button on the right opens the selected IP Zone
● IP Graphing – Sensor Cluster can generate IP graphs for the summed up traffic data. It defaults to Not Aggregated
▪ Aggregated – Enables IP graphing within the Sensor Cluster and disables IP graphing in the associated Sensors
▪ Not Aggregated – Enables IP graphing per associated Sensor and disables IP graphing in the Sensor Cluster
● Anomaly Detection – Sensor Cluster can detect anomalies in the summed up traffic data. It defaults to Aggregated
▪ Aggregated – Enables anomaly detection in the Sensor Cluster, disabling it in associated Sensors. To view anomaly graphs, set IP Graphing to Aggregated as well
▪ Not Aggregated – Enables anomaly detection in each associated Sensor, disabling it in the Sensor Cluster
▪ Duplicated – Enables anomaly detection in both the Sensor Cluster and the associated Sensors
● Performance – Adjust how aggressively the Sensor Cluster uses system resources:
▪ Conservative – Single anomaly-processing thread
▪ Balanced – 10 anomaly-processing threads
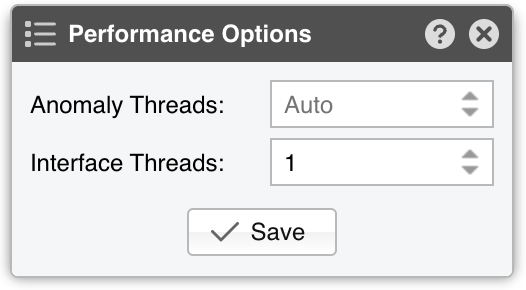
▪ Custom – Manually set the number of threads:
• Anomaly Threads – Number of parallel threads dedicated to anomaly processing, up to 255. Each thread maintains a dedicated SQL connection. Leave it on Auto to let the Sensor Cluster decide
• Interface Threads – Number of parallel database connections used to fetch the Associated Sensors’ traffic data on every cycle. A value of 1 disables parallel fetching, and the field cannot exceed the number of Associated Sensors you have selected. Increase it when the Sensor Cluster aggregates many Sensors and logs skipped ticks or “Performance issues” events
● Comments – Record any Sensor Cluster notes here. These remarks are for internal reference only and will not be visible elsewhere. The section stays collapsed until it holds text
If a Sensor has been deleted after it was added to the Sensor Cluster, saving the Sensor Cluster quietly drops it from the Associated Sensors list. A Sensor Cluster left without a single Associated Sensor is refused.
[Save] writes the configuration. [Delete] appears only after the Sensor Cluster has been saved once, and asks for confirmation. A Sensor Cluster that is still used by a Reports » Dashboards widget or by a Scheduled Reports entry cannot be deleted; the Console names what still refers to it.
A Sensor Cluster that still detects active anomalies cannot be deleted either — wait until no anomaly is active, or stop them manually.