28. General Settings » Data Retention
In Configuration » General Settings » Data Retention, you can review the software’s disk usage and set how long data is retained. The Data Retention Settings window measures the size of every database table as it opens, so it may take a while to appear on a large database.
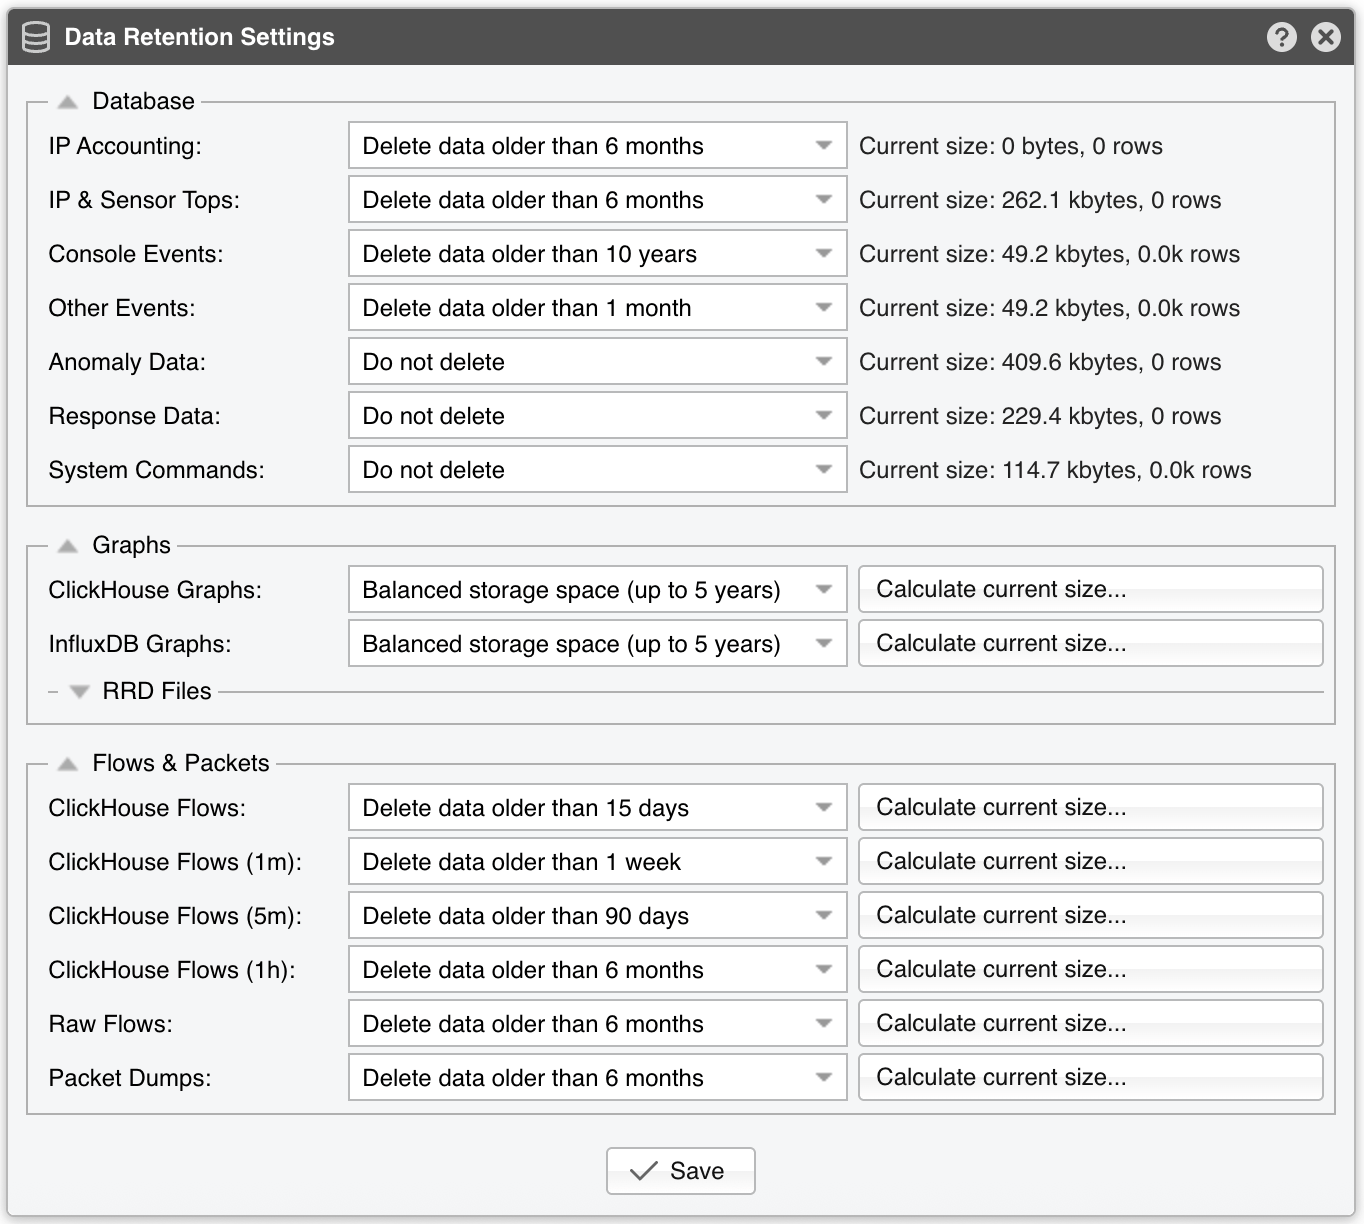
Every combo box of the Database section, as well as the Raw Flows and Packet Dumps combo boxes, offers the same choices: Do not delete, or delete data older than an interval ranging from 1 hour to 50 years. The four ClickHouse Flows tiers always need a retention period, within the bounds described below. [Save] is the only button, and it does something only when a value actually changed: the Console then queues a maintenance run straight away, and an IP Accounting purge two minutes later, instead of waiting for the hourly one.
The Database section sets how long each kind of record is kept in the SQL database. The text on the right of every combo box reports the size the corresponding tables occupy today, and the number of rows they hold. Both figures are the estimates the database reports, so they are approximate.
● IP Accounting – This can generate thousands of tables over time (each table = 1 day × 1 Sensor interface). Keep retention days low to limit table creation. It cannot be purged sooner than 2 days● IP & Sensor Tops – These tables grow quickly because they store binary data for Sensor Tops. If disk space is limited, use a low retention● Console Events – The events generated by the Console itself: configuration changes, user logins, and the like. Retain this as long as feasible● Other Events – The events generated by every other component. They share one SQL table with the Console Events, so keep the combined row count under a few million to maintain Console performance● Anomaly Data – The attack-related data behind the Reports » Tools » Anomalies reports. Retain for as long as possible● Response Data – The archives of the actions carried out by Network & Policy » Responses. They assist in troubleshooting and typically do not grow rapidly under normal usage● System Commands – The queue of the commands the Console sent to the other components. It is useful for troubleshooting, and it doesn’t grow fast in normal conditions
The Flows & Packets section sets how long the flow and packet data is kept outside the SQL database. The [Calculate current size…] button on the right of these combo boxes measures how much space that data occupies right now, and reports it in a small window. The measurement runs on the Console server and it can take a while.
The flows the Flow Sensor stores in ClickHouse are held in four tiers of decreasing detail, each aged out on its own. Keeping raw detail short and aggregates long lets you hold months of trend data while storing only a few days of full per-flow records:
● ClickHouse Flows – The full-detail records, one row per flow. Defaults to 15 days. This is the only tier that keeps the TCP-flag and IP-TTL fields. All four tiers share the same underlying tables, so their [Calculate current size…] buttons report the same combined size● ClickHouse Flows (1m) – 1-minute aggregates of those flows. Defaults to 1 week● ClickHouse Flows (5m) – 5-minute aggregates. Defaults to 90 days● ClickHouse Flows (1h) – 1-hour aggregates. Defaults to 6 months● Raw Flows – The files written by the Flow Collector. Their filesystem path is set in General Settings » Graphs & Storage● Packet Dumps – The pcap files written by the packet captures. Their filesystem path is set in General Settings » Graphs & Storage
Each ClickHouse Flows tier is aged out one whole ClickHouse partition at a time, so a retention shorter than that tier’s partition width has no effect — the Console rejects any value below 7.2 hours (full detail), 3.4 hours (1m), 1.8 days (5m), or 7.2 days (1h). The same fixed width also bounds the other end: a long retention spreads a table over many partitions, and past about a thousand of them ClickHouse slows down, so the Console also rejects any value above 300 days (full detail), 140 days (1m), 1800 days (5m), or 7200 days (1h). For the same reason, a tier is not fully cleared until up to one partition past the configured age: a 30-day setting on the 5-minute tier actually clears at 30 to 31.8 days. Lowering a value also removes the now-expired data on the next maintenance run, with the freed disk space reclaimed in the background. Flow Sensors that write to the same ClickHouse database share these tables, and therefore share one retention policy.
These four settings bound the age of the flows, not their size, so a traffic surge can still fill the disk inside the configured window. To reclaim ClickHouse space immediately, run /opt/andrisoft/bin/WANmaintenance clickhouse_trim_flows <bytes>[K|M|G|T] [dry_run] on the Console server: it drops the oldest flow partitions — full detail first, aggregates last, never a table’s newest partition — until each ClickHouse target’s flow tables fit within the budget. Append dry_run to preview the drops without deleting anything.
The Graphs section sets how long the graph data is kept. Instead of a single retention interval, the two graph databases, ClickHouse and InfluxDB, each take a storage profile that spreads several retention policies over the graph archives:
● ClickHouse Graphs – Used only when General Settings » Graphs & Storage stores the graphs in ClickHouse:▪ Small storage space (up to 1 year) – The long-range archives are dropped after a year▪ Balanced storage space (up to 5 years) – The default▪ Large storage space (up to 15 years) – Every archive is kept three times as long as in the balanced profile● InfluxDB Graphs – The same three profiles, used only when General Settings » Graphs & Storage stores the graphs in InfluxDB● RRD Files – A collapsed section, shown only for reference: RRD graph files are never touched by any retention setting, because they are created at their final size and do not grow over time. Expand it to see, for every Sensor interface, how much disk space its IP graphs occupy, how many files there are, what share of them is IPv6, and where they live. [Reset Stats] zeroes those counters, and it should be clicked only after you have deleted the graph files by hand
Both databases keep every graph in up to three archives of decreasing detail, and the profile sets how long each archive is kept. With the balanced profile:
The small profile keeps nothing longer than a year, and the averaged archives of the IP and Application graphs for only 3 months; the large profile keeps every archive three times as long as the balanced one. A graph is always drawn from the most detailed archive that still covers its whole time range.
Changing either storage profile rewrites the retention policies in /opt/andrisoft/etc/graphs.conf and schedules the graph database to be reconfigured accordingly.
Note
The database is purged of old data once every hour, and also right after a Data Retention value is saved. Use the following command to purge it on demand:
[root@console ~]# sudo -u andrisoft /opt/andrisoft/bin/WANmaintenance
On some systems, MariaDB won’t fully reclaim freed space and reserves it for future use. To reclaim disk space, run the following command on the Console server (this may take a significant amount of time):
[root@console ~]# /opt/andrisoft/bin/WANmaintenance optimize_db
You can back up the entire database by running the following command on the Console server:
[root@console ~]# /opt/andrisoft/bin/WANmaintenance backup_db
You can back up only the software configuration by running the following command on the Console server:
[root@console ~]# /opt/andrisoft/bin/WANmaintenance backup_config
The resulting backup file is placed in the current directory. To restore it on a different Console server:
[root@new_console ~]# mysql -p andrisoft < wanguard_*.sql
28.1. Disk Full Troubleshooting
Like any other system resource, disk space is limited. The software can collect and store very large quantities of data, depending on its configuration. If you think it’s using up too much disk space, read through this section to understand what might be the cause and how to prevent the disk from being filled in the future. When the disk is full on the Console server, it’s no longer possible to log in and some components will fail to run!
Unless you changed the default path for storing flows, graphs and dump files, you can use the ncdu utility or the following command to see what is using up your disk space (this may take up to a few minutes, depending on how many files you have):
[root@server ~]# du -ch -d 1 /var/lib/mysql/andrisoft /opt/andrisoft /var/lib/influxdb/data/andrisoft
28.1.1. Database
If the /var/lib/mysql/andrisoft directory occupies too much disk space, lower the parameters in Data Retention. Saving them queues a purge of the old data. However, on some distributions, MariaDB will not free up the deleted data and instead it will reserve the resulting disk space for future use. To reclaim the newly freed up disk space, execute the following command on the Console server (it might take a very long time to execute):
[root@console ~]# /opt/andrisoft/bin/WANmaintenance optimize_db
If the disk got filled, then it’s very likely that the database got corrupted and cannot be started. If this is the case, free up some disk space and execute:
[root@console ~]# /opt/andrisoft/bin/WANmaintenance repair_db
28.1.2. Packet Dumps
If the /opt/andrisoft/dumps directory occupies too much disk space, this means you have either done large packet dumps manually, or you have configured the software to capture large packet dumps in Network & Policy » Responses.
Recheck the configuration of the Traffic Capture actions alongside the New Packet Capture section, which explains each field in detail. Configuring the Max. Packets parameter is the best way to avoid unnecessarily large dump files.
Configure the software to delete old pcap files automatically in Data Retention » Packet Dumps.
If you need to clear up some disk space immediately, you can manually delete any files/directories from within the /opt/andrisoft/dumps directory but not the dumps directory itself. If you decide to delete directories or files manually, please allow the software to recreate them automatically and do not attempt to recreate them by yourself.
28.1.3. Flows
If the /opt/andrisoft/flows directory occupies too much disk space, this means the Flow Sensor is receiving lots of flows and you have chosen to save them by enabling the Flow Collector option.
As a first attempt to lower the disk space consumption of flows, select a more efficient Compression Algorithm.
Configure the software to delete old flows automatically in Data Retention » Raw Flows.
If you need to clear up some disk space immediately, you can delete any files/directories manually from within the /opt/andrisoft/flows directory but not the flows directory itself. If you decide to manually delete directories or files, please allow the software to recreate them automatically and do not attempt to recreate them by yourself.
28.1.4. IP Graphs (InfluxDB)
If the /var/lib/influxdb/data/andrisoft directory occupies too much disk space, then you probably configured the software to generate graph data files for a very large number of IPs.
The software can be configured to store graph data locally or on a remote server. If the existing Console doesn’t have enough disk space, you could use another server just for storing graphs.
By default, the graph data is saved in InfluxDB under the database
andrisoft. You can delete the existing database by executing theDROP DATABASE andrisoftcommand from within the InfluxDB CLI. Then, you can recreate the database in General Settings » Graphs & Storage.
28.1.5. IP Graphs (RRDTool)
If the /opt/andrisoft/graphs directory occupies too much disk space, this means you have either configured the software to generate graph data files for a very large number of IPs, or you have configured graph data files to contain an unnecessarily large amount of information.
InfluxDB and ClickHouse use less disk space than RRD files to store graph data, so consider switching to one of them in General Settings » Graphs & Storage.
To find out how much disk space each IP graph file requires, open the RRDTool options in General Settings » Graphs & Storage. Changing the Accuracy of Round Robin Archives, the Graph Data Units, the Graph Consolidation or the enabled decoders modifies the IP graph file size, which is displayed at the bottom of that window. It is possible that a lot of unnecessary information is stored for each IP and therefore it is best to reconsider the necessity of each option. The configuration is applied to all IP graph files, and it is currently not possible to choose different configuration options for different IP prefixes.
We strongly suggest disabling IP graphing for very large IPv4 prefixes or IPv6 prefixes from the Network & Policy » IP Zone. Depending on what you have configured in the General Settings » Graphs & Storage window, the software calculates how much storage is required in case you choose to turn on IP graphing for any IPv4 prefix. This is displayed in the “Storage Requirements” column of the IP Settings section, in the IP Zone Configuration window. You can immediately see that turning IP graphing on for large IP prefixes is not a good idea.
It is important to know that the software generates IP Graph files at their maximum size and updates them accordingly without modifying the size afterward. Therefore, you cannot assume that an IP with little traffic will occupy little space. An IP graph file is generated at the first packet that has that IP as a source or a destination address. A simple network scan on a /8 prefix for which IP graphing is enabled can flood your hard disk with full-sized IP graphing files.
You can aggregate IP graphing information collected by multiple Packet Sensors or Flow Sensor interfaces by using a Sensor Cluster.
If you need to clear up some disk space immediately, you can manually delete any files/directories from within the /opt/andrisoft/graphs directory but not the graphs directory itself. If you decide to delete directories or files manually, please allow the software to recreate them automatically and do not attempt to recreate them by yourself. To delete the IP graph files which were not updated in the last 90 days, execute:
[root@console ~]# find /opt/andrisoft/graphs/ips -mtime +90 -type f -exec /bin/rm {} \;