10. General Settings » Anomaly Detection

The anomaly detection engine can be configured in Configuration » General Settings » Anomaly Detection. The detection of anomalies must also be enabled individually for each subnet defined in the IP Zone.

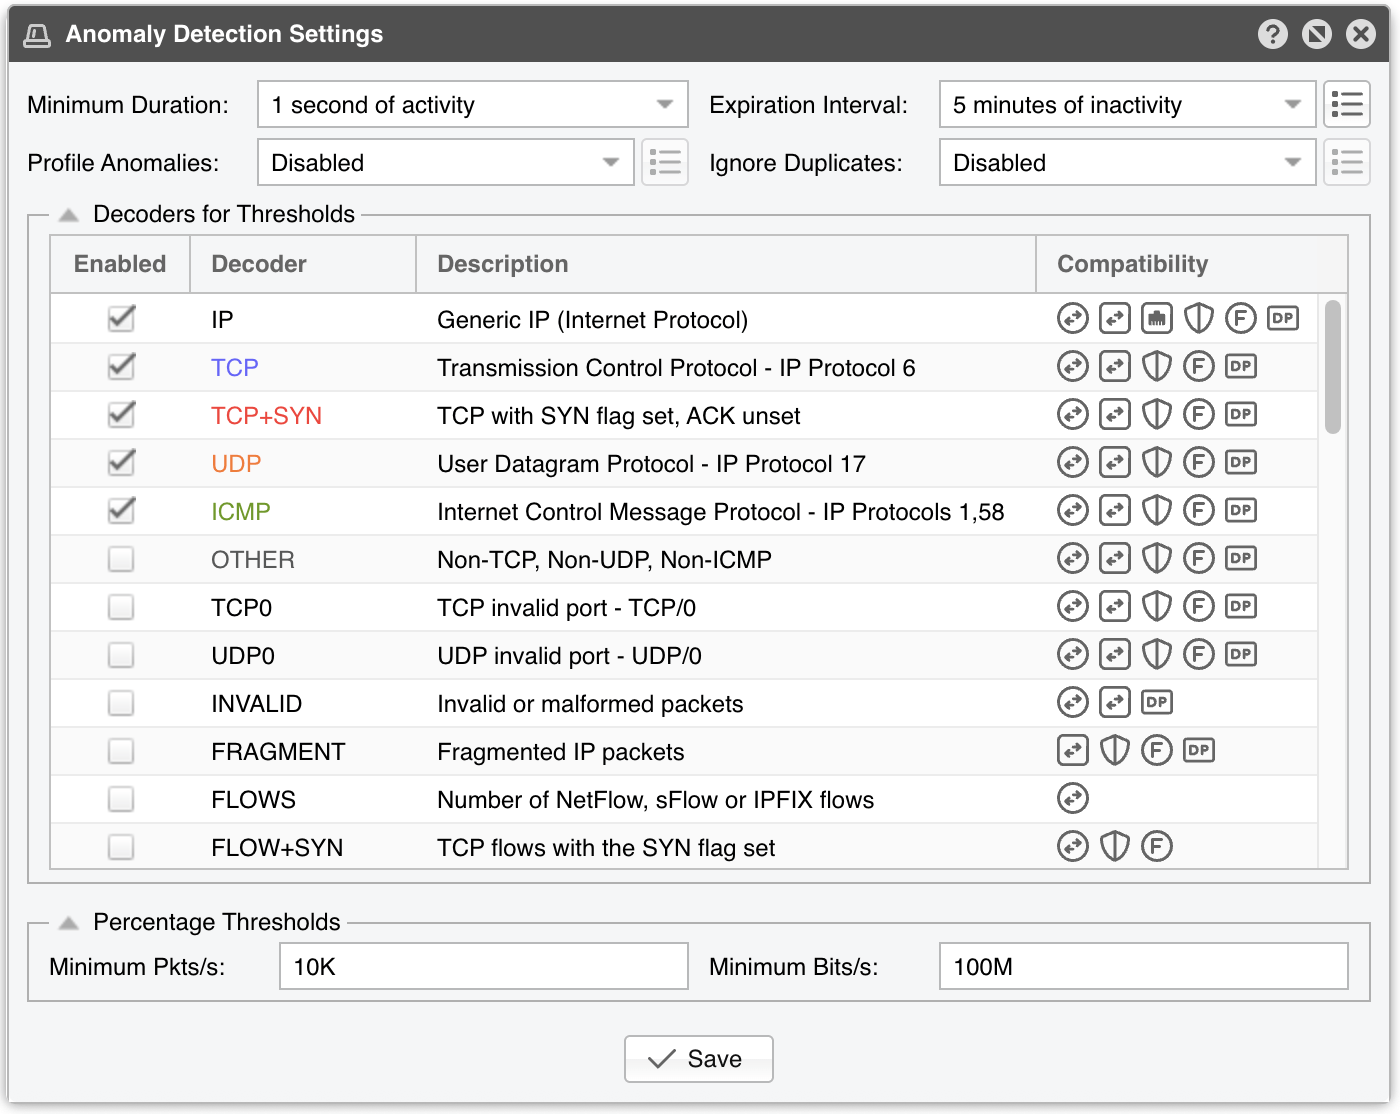
The Anomaly Detection Settings form opens with four global settings — three of which have an [Options] button that opens a dedicated window — followed by the Decoders for Thresholds grid and the Percentage Thresholds section, which starts collapsed. Both sections can be collapsed or expanded by clicking their title.
ANOMALY_DETECTION

Minimum Duration – Can be used to avoid reporting anomalies that are shorter than a predefined number of seconds, from 1 second of activity up to 1 hour of activity. When using Flow Sensor, the flow delay must be taken into consideration. If the first option is selected, the anomalies will be reported without delay because 1 second is the shortest time frame used to calculate traffic rates
Expiration Interval – Select how long an anomaly must stay inactive before it expires. The available values range from 1 minute of inactivity to 10 years of inactivity; the default is 5 minutes. When using Flow Sensor, consider the flow delay; do not lower the default value unless you are certain it is appropriate
EXPIRATION_OPTIONS
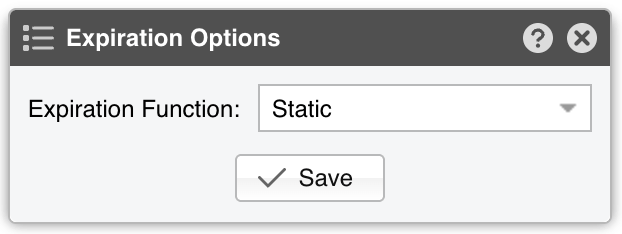
Expiration Function – Available by clicking the [Options] button of the Expiration Interval, which opens the Expiration Options window. Static keeps the Expiration Interval unchanged, while Linear increase and Exponential increase extend the inactivity interval before recurring anomalies expire (both up to 24 hours). The system considers similar anomalies received in the previous seven days
Profile Anomalies – Enables or disables the detection of traffic anomalies through the behavioral recognition approach described in the Profile Anomalies section below. While this is set to Disabled, the [Options] button on its right is greyed out
PROFILE_ANOMALIES_OPTIONS
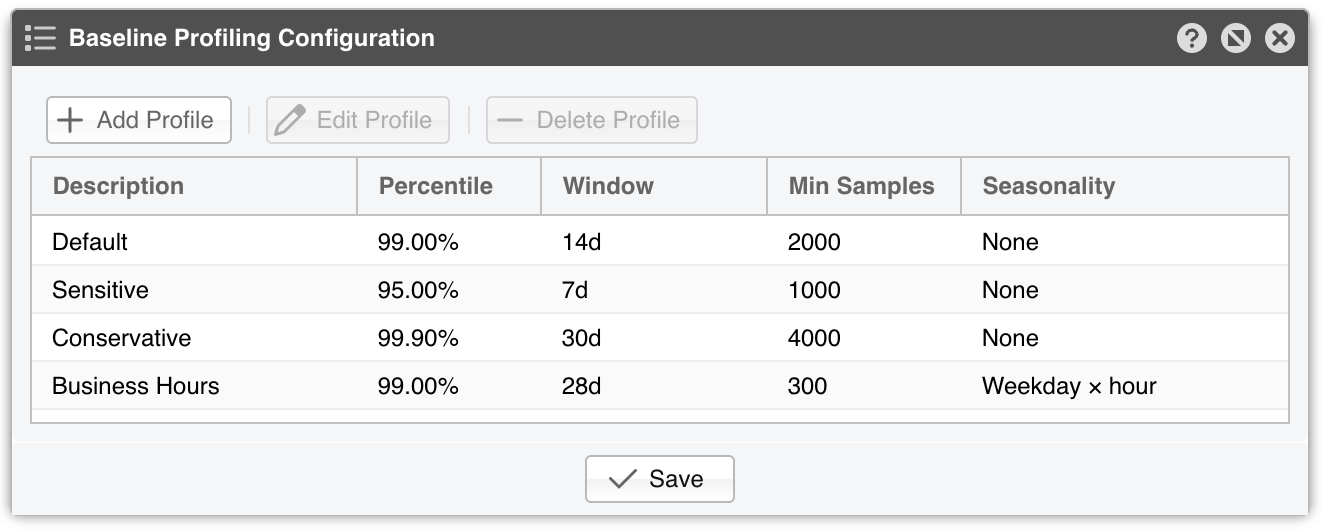
Baseline Profiling Configuration – Available by clicking the [Options] button of Profile Anomalies. The window lists every baseline profile in an editable grid whose columns are Description, Percentile, Window, Min Samples, and Seasonality (None, Hour of day, Weekday × hour, or Hour of week). Use [Add Profile], [Edit Profile], and [Delete Profile] to manage the list; double-clicking a row also opens it for editing. Percentile accepts values from 0.01 to 100 with two decimals, and Window is entered in seconds but displayed in the largest whole unit that fits, so 1209600 reads as 14d. A new profile starts with a 99% percentile, a 14-day window, no minimum sample count, and no seasonality. The Default profile cannot be deleted. The built-in profiles are described in the Network & Policy » Profiling Template chapter
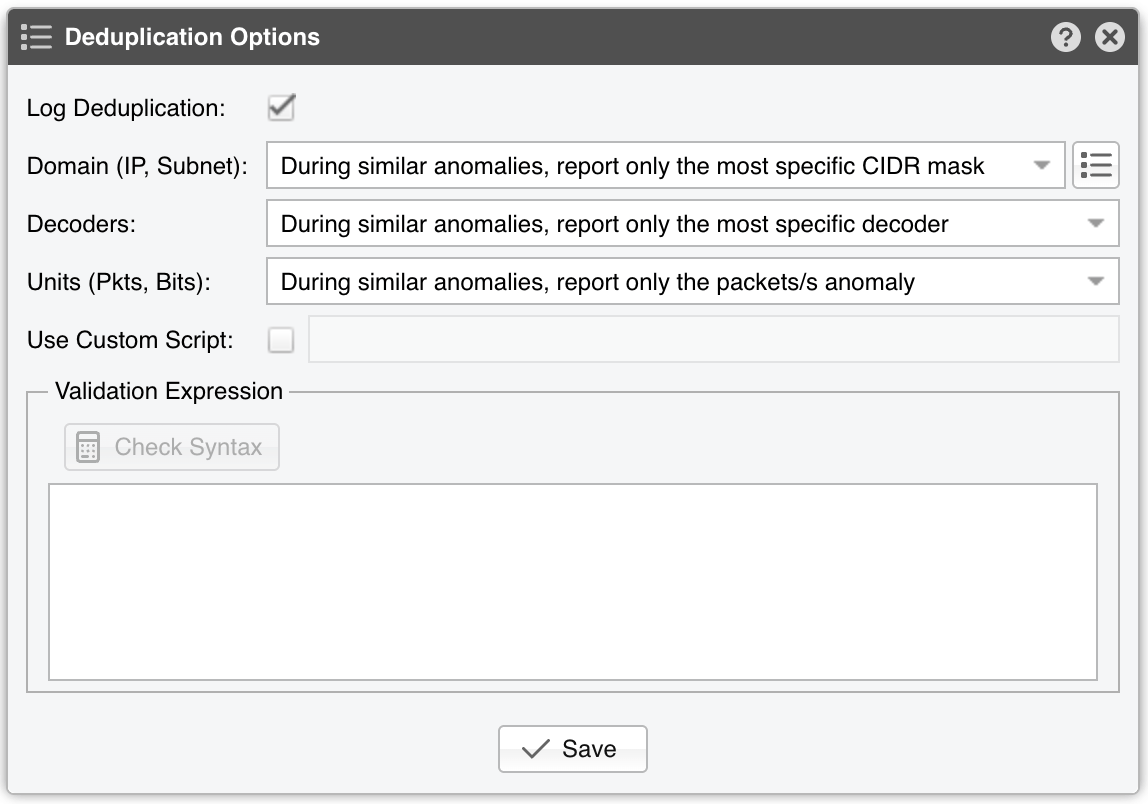
Ignore Duplicates – Set this to Enabled if you want to prevent the reporting of multiple anomalies for the same attack. Similar anomalies share the same start time. While it is set to Disabled, the [Options] button on its right is greyed out; click it to open the Deduplication Options window and select which anomalies to ignore:
ANOMALY_DEDUPLICATION
Log Deduplication – When checked, whenever a deduplication option suppresses an anomaly, a message with the INFO severity is written in Sensor Events
Domain (IP, Subnet) – Choose During similar anomalies, report only the most specific CIDR mask to ignore the anomalies detected by parent prefix(es) when a similar anomaly is detected for a more specific prefix (e.g. if you define a threshold for a /24 and a similar anomaly is detected towards a /32 included in the /24 subnet, only the /32 anomaly will be reported). If the threshold value of the less specific prefix is higher, and a more specific prefix is being reported, the traffic value of the more specific prefix is subtracted from the less specific prefix when comparing it to the threshold. The alternative, Report similar anomalies that target different domains, reports both and greys out the [Options] button next to the field
Sweep Merge – Available by clicking the [Options] button of the Domain deduplication option, which opens the Sweep Merge Options window. Merges simultaneous anomalies into their covering anomaly when more than this many sub-prefixes of it are under attack (carpet bombing). The field takes a whole number from 0 to 255; 0 disables the feature, and values of 3–4 are recommended. See the Sweep Merge section below for a detailed explanation
Decoders – With Report similar anomalies detected by different decoders, if you define a 500k pps threshold for the IP decoder, a 400k pps threshold for the TCP decoder, and a 30k pps threshold for the TCP+SYN decoder, and then a 600k pps TCP+SYN attack is being received, the Sensor will detect three anomalies, one for each decoder. With During similar anomalies, report only the most specific decoder, the Sensor will report a single anomaly for the most specific decoder, which in this case is TCP+SYN
Units (Pkts, Bits) – Choose During similar anomalies, report only the packets/s anomaly to ignore the anomaly for a bits/s threshold when a similar anomaly exists for a packets/s threshold. The alternative, Report similar anomalies that use different units, reports both
Use Custom Script – You can decide whether an anomaly is reported by using a custom script that accepts tokens as arguments. Tick the checkbox to enable the field next to it, which is mandatory and holds the command line. If the script’s exit status is non-zero, the anomaly is not reported. Usage is similar to the technique described in the Response chapter
Validation Expression – Alternatively, you can decide whether an anomaly is reported by writing a boolean expression that combines tokens tokens with comparison operators, and/or logic, and parentheses. The anomaly is reported only when the expression evaluates as true. [Check Syntax] becomes available as soon as the text area is not empty. It validates the expression on the server, which answers with either Expression Valid or Invalid Expression

Note

The Expiration Options, Baseline Profiling Configuration, Deduplication Options, and Sweep Merge Options windows do not save anything on their own. Their [Save] button only passes the edited values back to the Anomaly Detection form, so click [Save] at the bottom of the form to store them. Closing a window with its x button discards the changes made inside it.

10.1. Sweep Merge
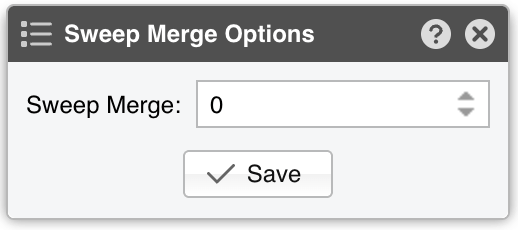
SWEEP_MERGE_OPTIONS

When an attack targets a single host or subnet, the Sensor reports the most specific anomaly it detected, and Domain deduplication suppresses the redundant anomaly raised on any covering prefix — you see 1.1.1.1/32 under attack, not 1.1.0.0/16. This is the preferred behavior when one destination is responsible for the traffic.

Distributed attacks invert the problem. A carpet-bombing attack spreads traffic across many destinations inside the same network block precisely to stay under per-host thresholds: detection then raises one anomaly for every affected sub-prefix, none of which individually explains the aggregate. With Subnet /N threshold rules, a sweep across a /24 monitored in /28 blocks can open up to 16 simultaneous anomalies — each with its own alerts and its own response actions, such as 16 separate blackhole announcements where one would do.

Sweep Merge sets the number of simultaneous sub-anomalies above which the Sensor reverses its preference. When more than the configured number of anomalies target sub-prefixes of the same covering anomaly — matching decoder, direction, and unit — the Sensor reports only the covering anomaly and merges the individual sub-anomalies into it. Below the configured number, the behavior is unchanged: specific anomalies are reported and the covering one is suppressed.

For example, consider a /24 subnet with a per-subnet threshold rule and Subnet /28 rules, with Sweep Merge set to 4. An attack on hosts inside two of the /28 blocks reports two /28 anomalies and suppresses the /24 one. A carpet-bombing attack spread across nine /28 blocks reports a single /24 anomaly; the nine /28 detections are merged into it, and the response action runs once, against the /24.

✔ Merging requires the covering anomaly to be detected in its own right — define a threshold rule at the prefix level you want sweeps merged into (for example, a per-subnet rule on the /24, or a coarser Subnet /N rule on the covering block). Without it, the sub-anomalies are reported individually regardless of this setting
✔ The setting applies to over-threshold rules on internal prefixes; anomalies for external IPs and under-threshold rules are unaffected. Sub-anomalies are counted per decoder, direction, and unit — a DNS sweep and a TOTAL sweep are evaluated independently
✔ Changes take effect on the next detection cycle of every Sensor, without restarting any component
✔ With Log Deduplication enabled, each merge is recorded in the events log, so you can audit what was collapsed
✔ Per-IP anomalies inside the covering prefix count toward the configured number as well — a sweep detected through individual host rules merges the same way

Wanguard Sensor detects traffic anomalies using two different methods:

10.2. Threshold Anomalies

Threshold Anomalies are breaches of user-defined traffic thresholds. These thresholds can be defined inside IP Zones for the decoders enabled in the Decoders for Thresholds list. Decoders represent internal functions (traffic dissectors) that differentiate and classify the underlying protocols of each packet or flow.

Enable only the decoders for which you need to define thresholds. The grid holds four columns: Enabled is the checkbox that makes the decoder available in the threshold editors, Decoder is its short name, Description explains what it matches, and Compatibility shows you if Packet Sensor, Flow Sensor or SNMP Sensor can use the decoder to detect anomalies, and if these anomalies could be mitigated by Packet Filter with Netfilter, or using Flowspec or the Dataplane Firewall. The icons of the Compatibility column always appear in the same order: Flow Sensor, Packet Sensor, SNMP Sensor, Filter, BGP Flowspec, and Dataplane (DPDK).

Thresholds can include either absolute values (e.g. IP receives 100k UDP packets/s) or percentage values (e.g. IP receives 30% UDP packets/s). To prevent Percentage Thresholds from being triggered for small amounts of traffic, configure minimum packets/s and bits/s values. Both Minimum Pkts/s and Minimum Bits/s are mandatory and understand the usual multipliers, so you can enter 10K or 100M instead of the full number. Percentage values are calculated based on the rates of the monitored interface, for the same decoder. E.g., for an interface that receives 100k UDP packets/s, a 30% UDP packets/s threshold defined for a single IP triggers an anomaly when the IP receives over 30k UDP packets/s.

10.3. Profile Anomalies

Profile Anomalies are detected through a behavioral recognition approach: the software computes a traffic baseline from the past traffic of each profiled prefix and detects any activity that deviates from the expected levels. Profiling requires at least one Graph Storage Engine set to ClickHouse in General Settings » Graphs & Storage. Profiling rules can be defined for every enabled decoder, with a per-rule sensitivity (as a multiple of the baseline) and a minimum floor under which no anomaly is triggered. The Network & Policy » Profiling Template chapter explains every metric of a profiling rule.

Profile anomaly detection works best for hosts and subnets that have a predictable traffic pattern; larger subnets have a much more predictable traffic pattern than smaller subnets. To reduce the number of false positives, adjust the per-rule sensitivity and configure a minimum floor.