26. Schedulers » Scheduled Reports
Most reports you access in the Reports Region can be printed, exported as PDFs, or emailed immediately. If you’d like to receive these reports on a schedule, go to Configuration » Schedulers and click [+] in the panel’s title bar.
To configure an existing Scheduled Report, go to Configuration » Schedulers and click its name.
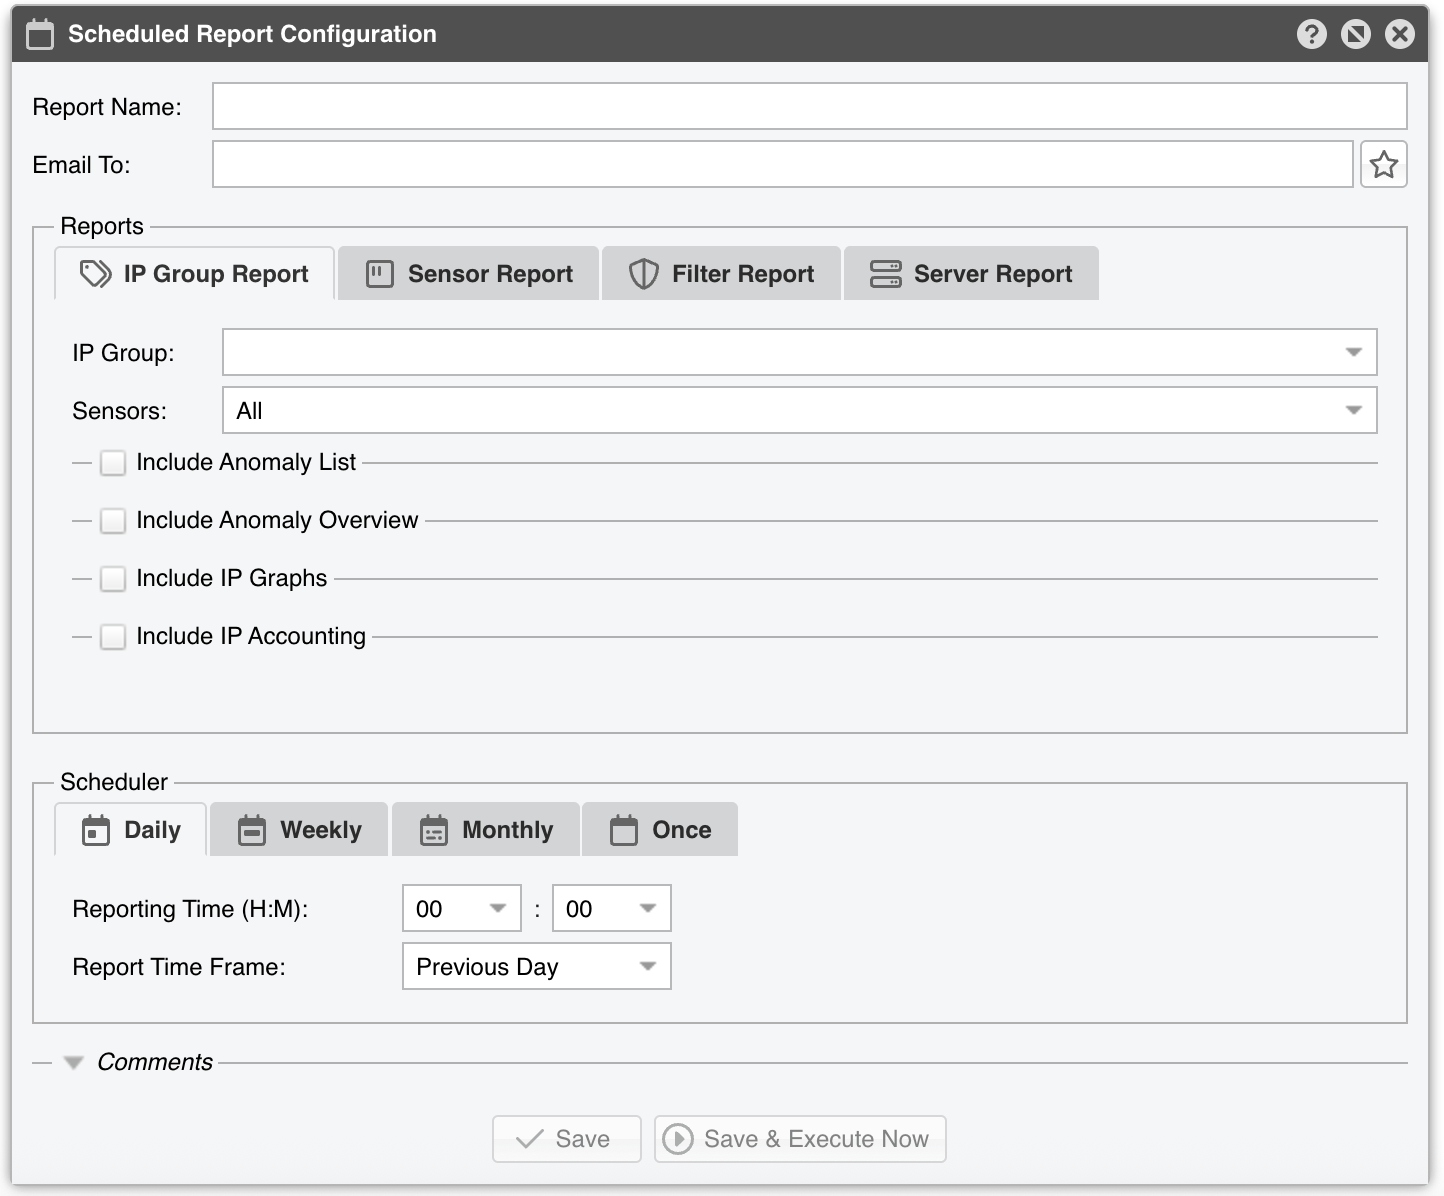
The Scheduled Report Configuration window opens on a form whose Report Name and Email To are mandatory: [Save] and [Save & Execute Now] both stay grayed out until the two of them are filled in.
● Report Name – A short label identifying this Scheduled Report● Email To – A single email address, or several addresses separated by commas. The star button on the right opens the Emails bookmarks, where frequently used addresses can be stored and recalled
The Reports section holds one tab per type of report. Each tab offers several subsections, and the checkbox in the title of a subsection includes that subsection in the email. Every subsection starts unticked and collapsed, and at least one of them must be ticked; otherwise, saving fails with “Empty reports not allowed!”.
Note
The subsections are independent of the tabs that hold them. A Scheduled Report emails every subsection you tick, so one report can combine, for instance, the IP Graphs of the IP Group Report tab with the Sensor Tops of the Sensor Report tab. The tab that is active when you save only decides which tab is reopened the next time you edit the report.
The IP Group Report tab reports on the traffic of a single IP Group:
● IP Group – The IP Group whose traffic is reported. IP Groups are defined in Network & Policy » IP Zone● Sensors – The Sensors whose data is used. It defaults to All, and the drop-down carries a search box● Include Anomaly List – A table of the anomalies detected for the IP Group▪ Fields – The columns of the table, chosen from Anomaly #, Prefix, IP Group, Anomaly, Value, Sensor, From, Until, Duration, Pkts/s, Bits/s, Response and Severity▪ Direction – List the Inbound anomalies, the Outbound ones, or both▪ Class – List All the anomalies, or only the Incoming or the Outgoing ones▪ Count – All the anomalies, or only the Top 1 to the Top 50 of them. It defaults to Top 10▪ Decoders – Restrict the table to particular decoders defined in General Settings » Custom Decoders, or leave it on All▪ Sort By – The column the table is sorted on. It defaults to Date● Include Anomaly Overview – Graphs that summarize the anomalies of the IP Group▪ Data Units – The units of the graphs, from Anomalies/s through Anomalies/year, the Filter Instances, the BGP Diversions, the BGP Blackholes, and the highest or stacked severities, packet rates and bit rates▪ Decoders – Restrict the graphs to particular decoders, or leave it on All▪ Consolidation – Plot the Maximum, the Average or the Minimum value of each interval▪ Stack Decoders – Stack the decoders on top of each other instead of overlaying them▪ Group Sensors – Sum the values of all the selected Sensors into a single graph● Include IP Graphs – The traffic graphs of the IP Group▪ Decoders – Restrict the graphs to particular decoders, or leave it on All▪ Consolidation – Plot the Maximum, the Average (the default) or the Minimum value of each interval▪ Data Unit – Graph Bits (the default), Bytes or Packets▪ Group Sensors – Sum the values of all the selected Sensors into a single graph▪ Stack Decoders – Stack the decoders on top of each other instead of overlaying them▪ Group Subnet IPs – Sum the individual IPs of a subnet instead of graphing each of them● Include IP Accounting – The accounting data of the IP Group▪ Decoders – Restrict the accounting to particular decoders, or leave it on All▪ Report Type – Account the traffic over a Daily, a Weekly (the default) or a Monthly interval. This is independent of how often the email is sent▪ Data Unit – Account in Bits (the default), Bytes or Packets▪ Show IPs – List the individual IPs of the group instead of only its totals▪ Group Sensors – Sum the values of all the selected Sensors
The Sensor Report tab reports on the traffic seen by the Sensors themselves:
● Sensors – The Sensors whose data is reported. It defaults to All, and the drop-down carries a search box● Include Anomaly List – A table of the anomalies detected by the Sensors. Its parameters are those of the IP Group Report tab, except that Class lists All the anomalies, or only those raised by a Profile or by Thresholds● Include Anomaly Overview – Graphs that summarize the anomalies of the Sensors. Its parameters are those of the IP Group Report tab, except that the last checkbox is named Group Decoders● Include Sensor Graphs – The traffic graphs of the Sensors▪ Data Units – One of the Sensor data units, such as Bits (the default), Packets, Applications, Internal IPs, Dropped Frames, CPU% or RAM▪ Consolidation – Plot the Maximum, the Average or the Minimum value of each interval▪ Group Sensors – Sum the values of all the selected Sensors into a single graph● Include Sensor Tops – The tops of the traffic seen by the Sensors▪ Top Unit – What is ranked: Talkers (the default), IP Groups, External IPs, Upstream ASNs, Transit ASNs, Peering ASNs, Downstream ASNs, Countries, TCP Ports, UDP Ports, IP Protocols or IP Versions▪ Direction – Rank the Inbound or the Outbound traffic▪ Display – How the top is drawn, from plain Text through Text & Histogram, Text & Pie, Text & Donut and the chart-only variants▪ Decoders – The decoder the top is computed on▪ Data Units – Rank by Packets (the default) or by Bits▪ Slice Label – The labels drawn on the slices of the chart, from No Labels to Legend▪ Group Sensors – Sum the values of all the selected Sensors▪ Show DNS – Resolve the IP addresses to hostnames
The Filter Report tab reports on the activity of the Filters:
● Filters – The Filters whose data is reported. It defaults to All● Include Filter Graphs – The graphs of the Filters▪ Data Units – One of the Filter data units, such as Anomalies (the default), Filtering Rules, Peak Filtered Packets or Total Scrubbed Packets▪ Consolidation – Plot the Maximum, the Average or the Minimum value of each interval▪ Group Filters – Sum the values of all the selected Filters into a single graph● Include Filtering Rules Tops – A table of the filtering rules applied by the Filters, of the kind shown in Reports » Tools » Firewall▪ Fields – The columns of the table, chosen from Status, Filter Name, Anomaly #, Prefix, IP Group, Sensor, Decoder, Filtering Rule, From, Until, Duration, Firewall, and the packet and bit rates▪ Limit – How many rules are listed, between 1 and 300. It defaults to 15▪ Sort By – The column the table is sorted on. It defaults to Filter Name▪ Sorting – Sort Ascending or Descending▪ Show DNS – Resolve the IP addresses to hostnames
The Server Report tab reports on the health of the servers:
● Servers – The servers whose data is reported. It defaults to All● Include Server Graphs – The graphs of the servers▪ Data Units – One of the server data units, such as System Load (the default), Free RAM, Uptime, the CPU percentages, the disk metrics, or the counters of the running components▪ Consolidation – Plot the Maximum, the Average or the Minimum value of each interval▪ Group Servers – Sum the values of all the selected servers into a single graph
The Scheduler section holds one tab per sending frequency, and the tab that is active when you save decides when the email is sent:
● Daily – The email is sent every day▪ Reporting Time (H:M) – The hour and the minute of the day, the minutes in steps of five▪ Report Time Frame – The interval the report covers: Previous Day (the default), Last 24 Hours, Today, or anything from the last 6 hours down to the last 5 minutes● Weekly – The email is sent every week▪ Reporting Time (DoW H:M) – The day of the week, the hour and the minute▪ Report Time Frame – Previous Week (the default) or Previous 7 Days● Monthly – The email is sent every month▪ Reporting Time (Day H:M) – The day of the month, the hour and the minute▪ Report Time Frame – Previous Month (the default) or Previous 30 Days● Once – The email is sent a single time▪ Reporting Time (Date H:M) – The date, the hour and the minute, interpreted as UTC▪ Report Time Frame – The interval the report covers, from Previous Day through Last Year, defaulting to Today. Selecting Custom… enables the two date fields on its right, which take the start and the end of the interval; every other value grays them out and clears them
A collapsed Comments section at the bottom stores internal notes about the Scheduled Report; they are not displayed anywhere else.
[Save] writes the configuration, [Save & Execute Now] writes it and sends the email immediately, and [Delete] — shown only after the Scheduled Report has been saved once — removes it after asking for confirmation.
Note
A new Scheduled Report is created disabled, so no email is sent on schedule until you enable it with the on/off switch next to its name in Configuration » Schedulers. [Save & Execute Now] sends the email whether the report is enabled or not.
Note
To preview the email before the scheduled time, enter your address and click [Save & Execute Now]. If the email doesn’t arrive within a few seconds, double-check the settings from General Settings » Outgoing Email.