18. Components » Flow Sensor
Most routers and many enterprise switches can collect IP traffic statistics and export them as flow records to Flow Sensor. Because the flow protocol pre-aggregates traffic data, the flows sent to Flow Sensor are significantly smaller than the traffic being monitored. This makes Flow Sensor ideal for monitoring remote or high-traffic networks. For a comparison of flow-based and packet-based monitoring, see the Choosing a Method of Traffic Monitoring chapter.
Appendix 2 shows how to enable NetFlow, sFlow, or IPFIX on a number of devices, but the best and most up-to-date instructions can only be found in the vendor’s documentation.
To add a Flow Sensor, click [+] in the title bar of the Configuration » Components panel. To modify an existing Flow Sensor, go to Configuration » Components and click its name.
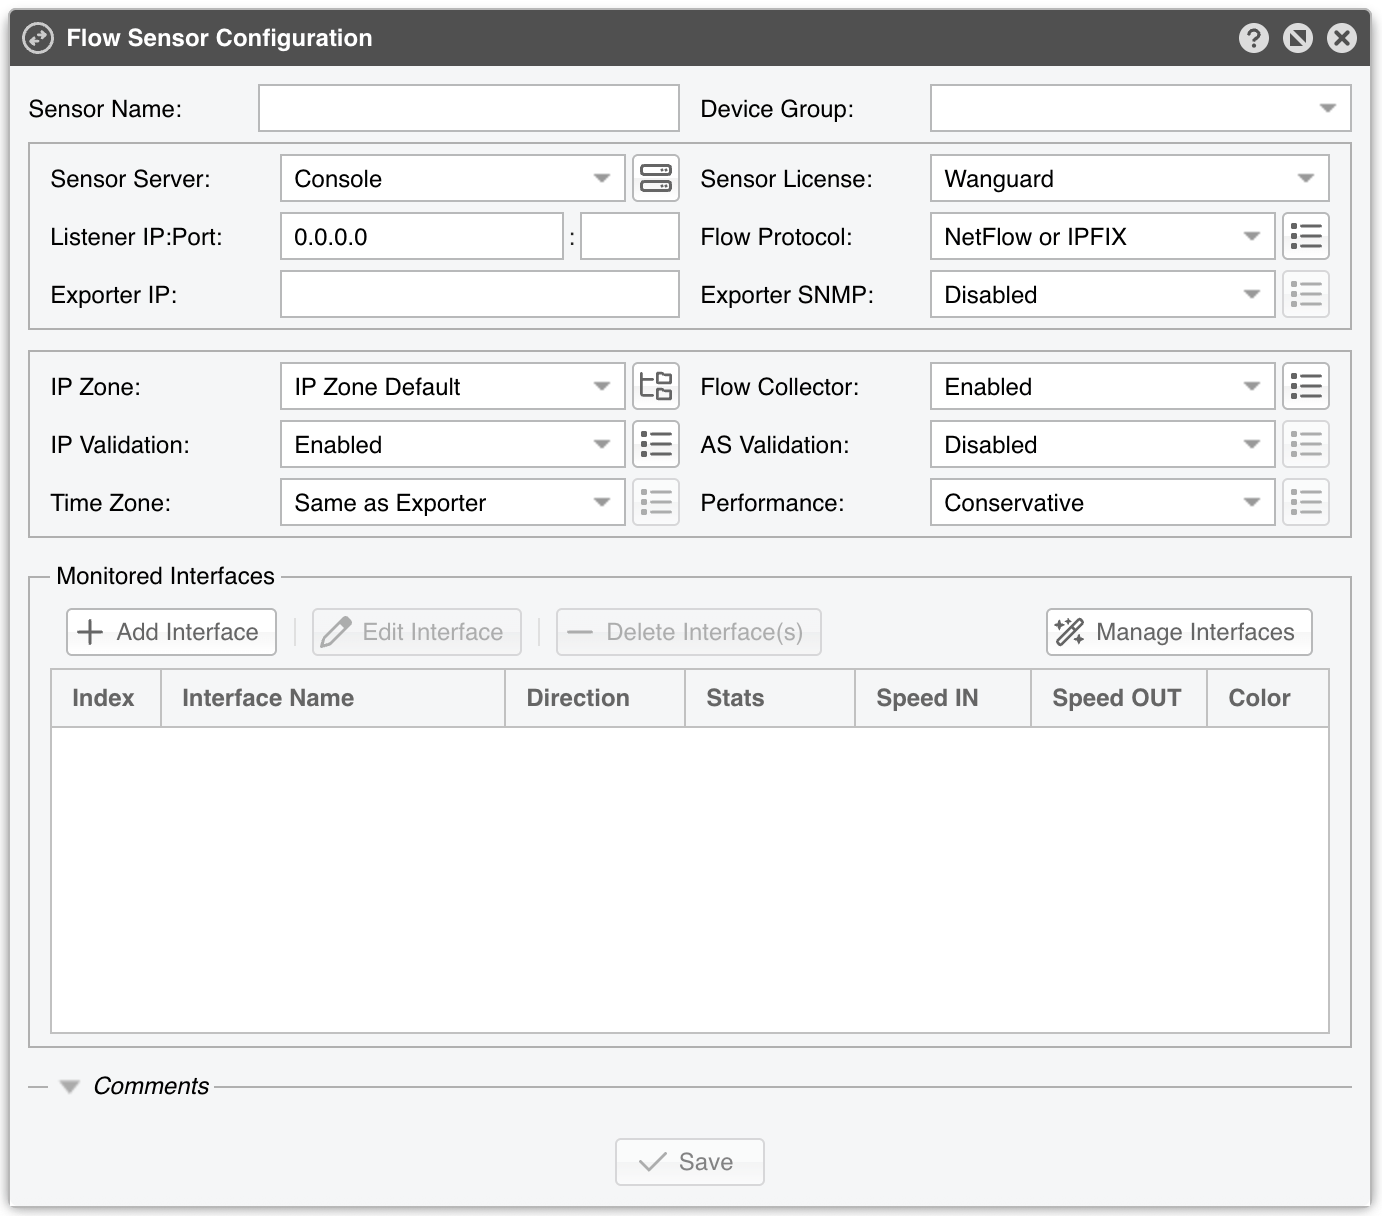
The Flow Sensor Configuration window is a form followed by the Monitored Interfaces grid. The Sensor Name, the Sensor Server, the Listener IP and port, the Exporter IP and the IP Zone are mandatory, and [Save] stays grayed out until they are filled in. A Flow Sensor also needs at least one monitored interface — saving without one is refused.
Flow Sensor Configuration parameters:
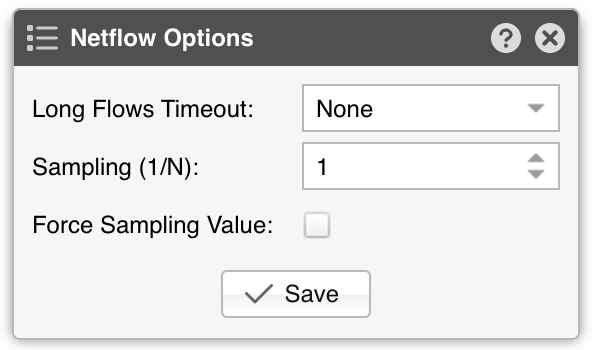
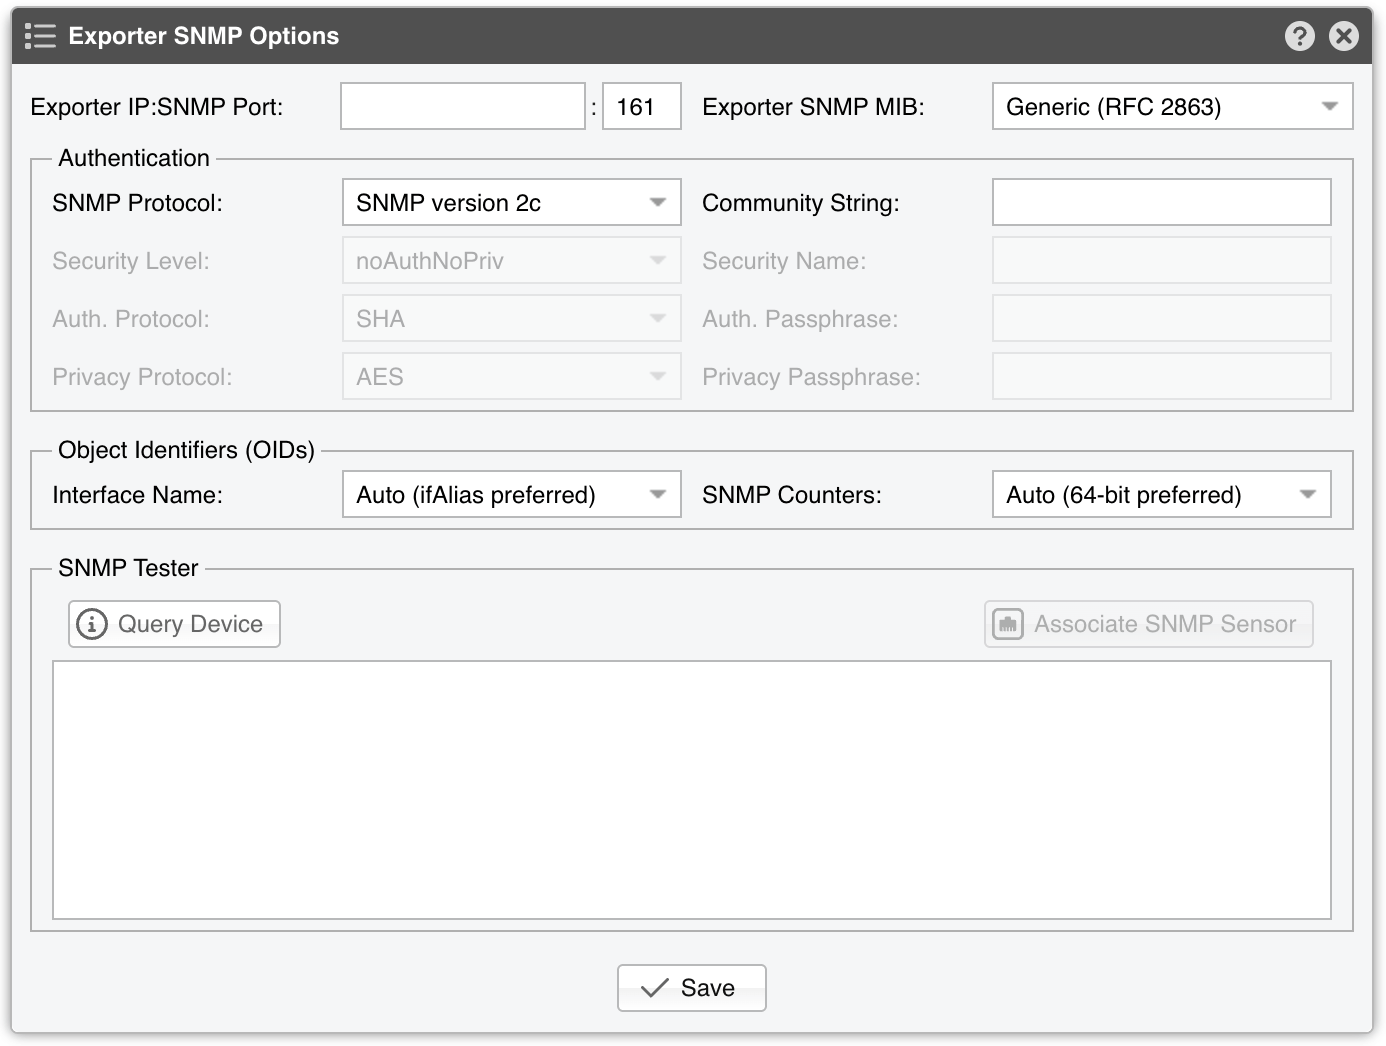
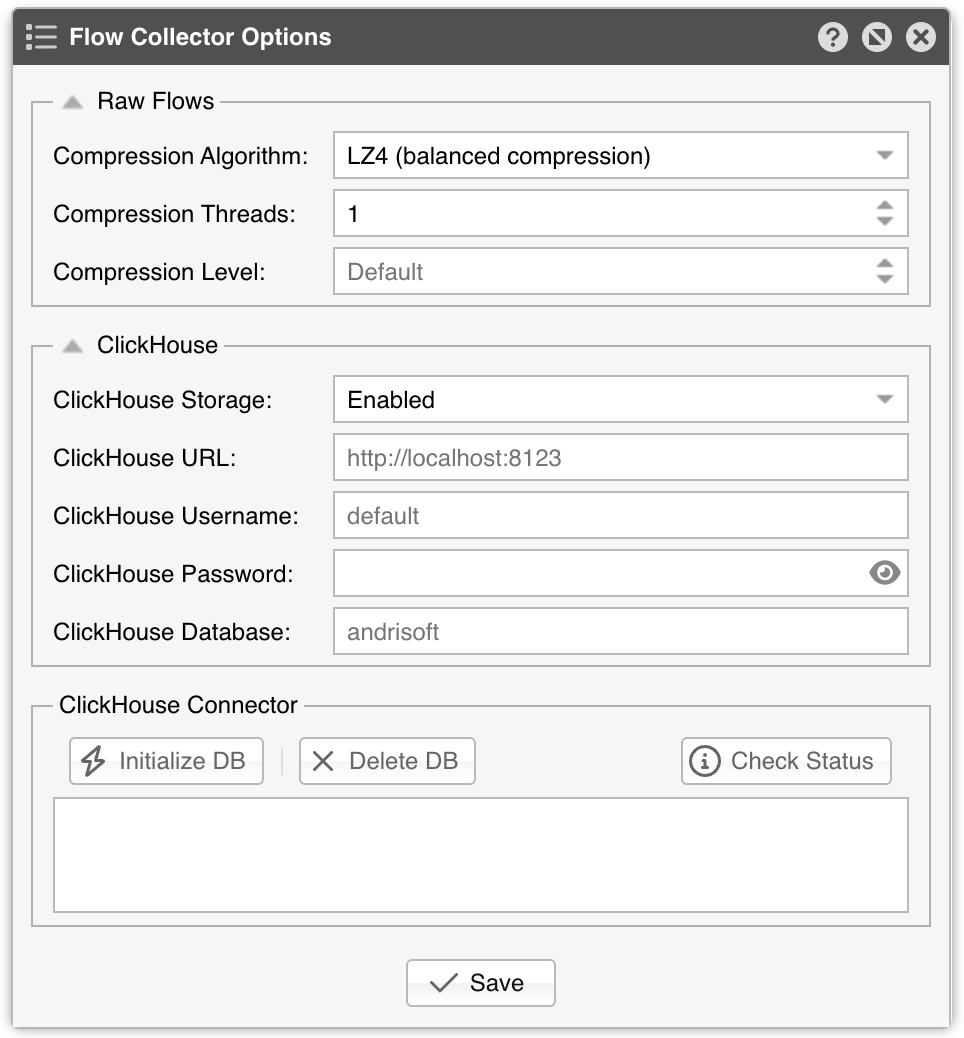
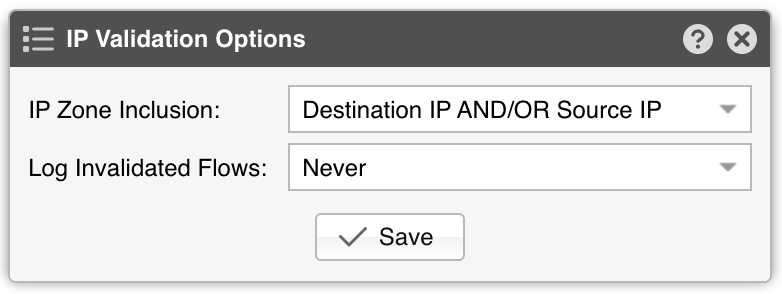
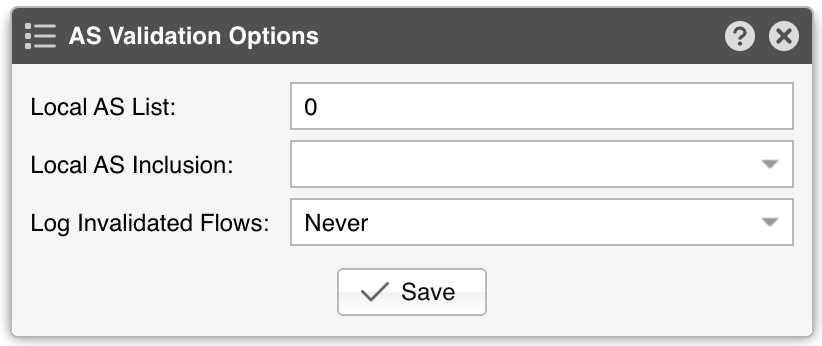
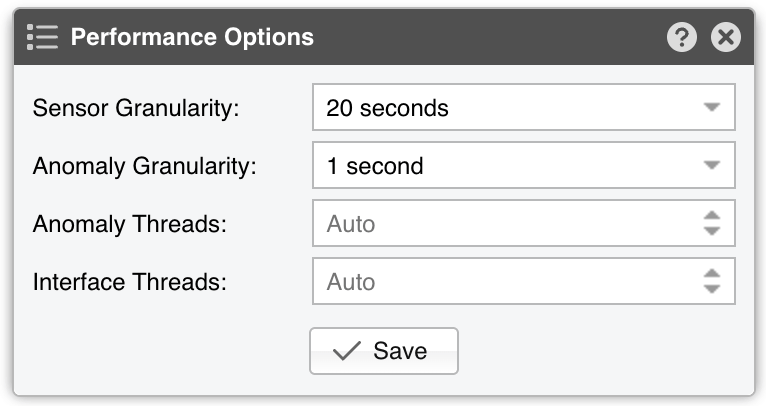
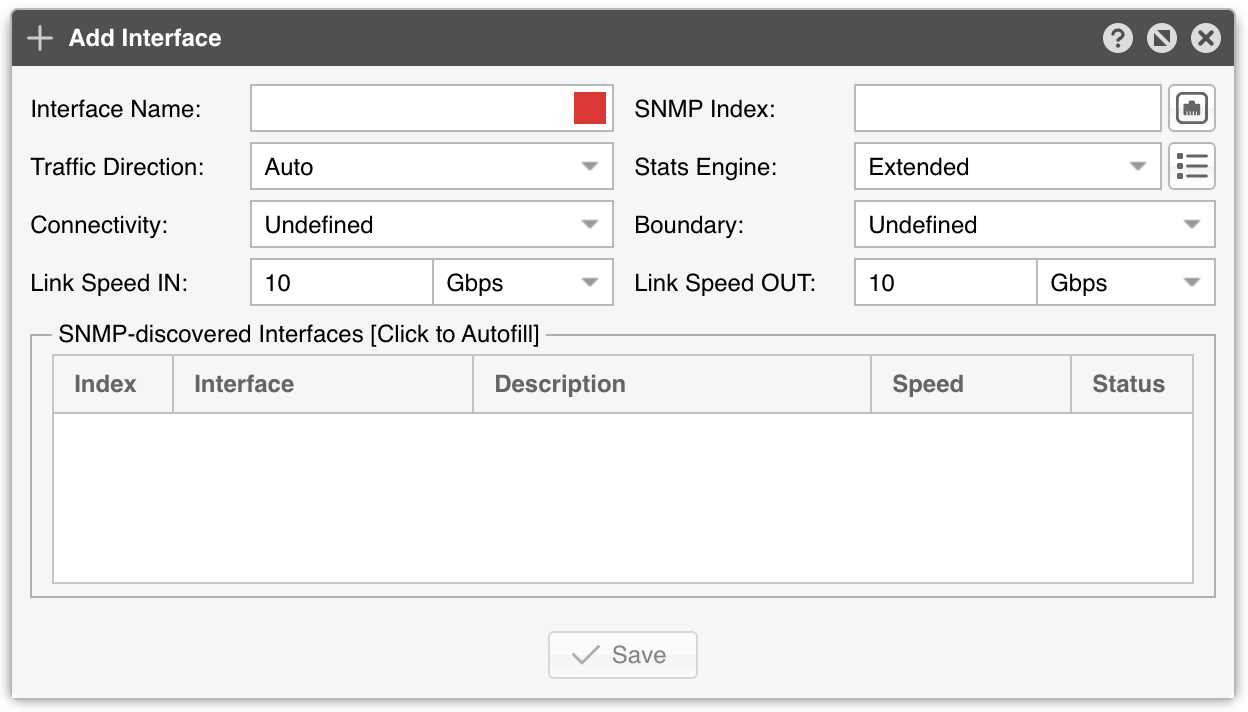
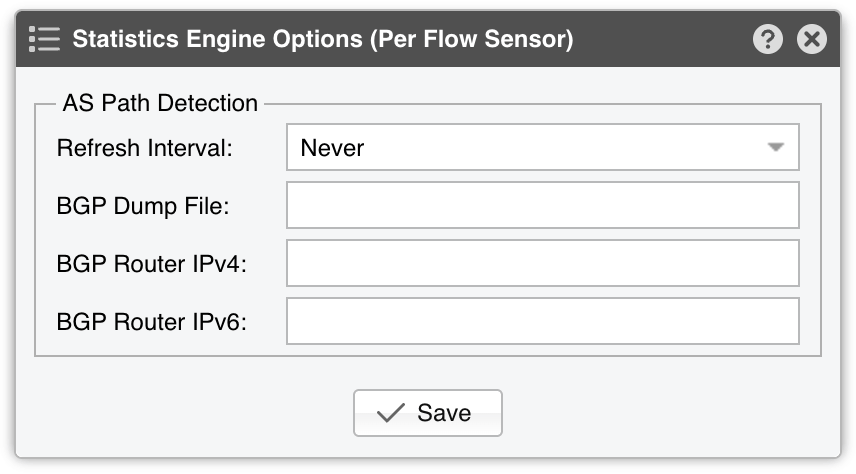
● Sensor Name – A short name to identify the Flow Sensor● Device Group – Optional label for organizing components by location or characteristics, or for granular role-based access. The combo box is editable, so you can type a new group instead of selecting an existing one● Sensor Server – Select a server that fulfills the minimum system requirements for running the Flow Sensor. If this is not the Console server, follow the NFS configuration steps to make the flow data visible in the web interface. The button on the right opens the configuration of the selected server● Sensor License – The license used by the Flow Sensor. Wanguard provides all features; Wansight does not provide traffic anomaly detection and reaction, so it also hides the Anomaly Granularity and Anomaly Threads options● Listener IP:Port – The IP address (IPv4 or IPv6) and destination port on which flow packets are received. The port has to be higher than 1024. Each flow exporter must use a unique destination port if multiple exporters are sending flows to the same server; the Console refuses to save two Flow Sensors that listen on the same IP and port of the same server● Flow Protocol – The flow protocol used by the flow exporter:▪ NetFlow or IPFIX – Select if your router exports NetFlow v5, v7, v9 or IPFIX. IPFIX information element 315 (dataLinkFrameSection, used by Juniper inline monitoring services) is also supported. Click on the options button on the right-hand side of the field for NetFlow-specific options:• Long Flows Timeout – For routers like Juniper MX that maintain the start time of previously exported flows, set this to the flow active/inactive timeout in the router’s config (commonly 60 seconds). The list runs from 5 to 300 seconds. For other exporters, leave it on None• Sampling (1/N) – Enter the sampling rate configured on the exporter, up to 250,000, or leave the default if no sampling is set• Force Sampling Value – Tick this checkbox to override the exporter’s reported sampling value if misread▪ sFlow – Choose this if your router exports flows using the sFlow protocol, then click on the options button on the right-hand side for sFlow-specific options:• GRE Decapsulation – When Enabled, Flow Sensor analyzes the inner packet of GRE-encapsulated samples rather than the GRE header● Exporter IP – IP address of the flow exporter (router, switch, or probe). For sFlow, specify the IP actually sending the flow packets (not the Agent IP)● Exporter SNMP – You must enable SNMP on the flow exporter to allow Console to extract interface information automatically. It is Disabled by default, and the options button stays grayed out until you enable it▪ Enabled – Click the options button beside Exporter SNMP to configure:• Exporter IP:SNMP Port – The IP address and SNMP port of the flow exporter (the default SNMP port is 161)• Exporter SNMP MIB – The MIB used to read the interface information from the flow exporter: Generic (RFC 2863) or Huawei 16-bit• SNMP Protocol – The SNMP version used by the flow exporter: SNMP version 1, SNMP version 2c, or SNMP version 3. The fields that follow are enabled according to the version you pick• Community String – The SNMP community string, when using SNMP version 1 or 2c• Security Level, Security Name – The SNMPv3 security level (noAuthNoPriv, authNoPriv, or authPriv) and security name• Auth. Protocol, Auth. Passphrase – The SNMPv3 authentication protocol and passphrase• Privacy Protocol, Privacy Passphrase – The SNMPv3 privacy protocol and passphrase• Interface Name – The OID that interface names are read from: Auto (ifAlias preferred), ifAlias, ifDescr, ifName, ifDescr ifAlias, or ifName ifAlias• SNMP Counters – Auto (64-bit preferred), 32-bit, or 64-bit. Choose 32-bit only if your device doesn’t support 64-bit counters. SNMP version 1 cannot use 64-bit counters at all, and the Console refuses to save that combination• SNMP Tester – [Query Device] polls the exporter and prints the reply in the pane below, so you can confirm the credentials before saving. [Associate SNMP Sensor] creates an SNMP Sensor for the same device, and is grayed out once one exists▪ Disabled – If SNMP is not set up, you must manually add each interface and specify its SNMP index, speed, etc.● IP Zone – Flow Sensor uses the IP Zone to learn the network’s boundaries and apply per-subnet settings. The button on the right opens the selected IP Zone● Flow Collector – When Enabled, raw flow data is saved to disk. You can query flow records in Reports » Tools » Flows, and limit disk usage in General Settings » Data Retention• Flow Filtering Expression - Restricts which flows are analyzed. Click the star icon for syntax details; frequently used expressions can be saved as bookmarks and reused• Compression Algorithm - Flow Sensor supports LZO, BZ2, LZ4, or ZSTD for compressing raw flow data, or No compression at all. LZO is fastest, BZ2 has the best compression ratio (though ~30 times slower), and LZ4/ZSTD balance speed and efficiency• Compression Threads - Allows between 1 and 8 threads for compressing raw flows. Typically, 1 thread suffices. If CPU usage exceeds 50%, consider raising this number. The field is grayed out when the algorithm is No compression• Compression Level - Available only for LZ4 and ZSTD. If left empty (Default) or set to 0, the default compression level is used• ClickHouse Storage - When Enabled, flow data is additionally stored in ClickHouse. This is required for the interactive charts in the Flow Graphs sub-tab of Reports » Tools » Flows (Stacked Areas, Stacked 100%, Lines, Grid, Sankey, and Heatmap, grouped by most dimensions that exist in flow data). The five fields that follow stay grayed out until you enable it• ClickHouse URL - The full URL of the ClickHouse HTTP(S) interface. The default ishttp://localhost:8123• ClickHouse Username and ClickHouse Password - Required only when authentication is enabled on the ClickHouse server. The default username is default• ClickHouse Database - Optional. The default database name is andrisoft• ClickHouse Connector - [Initialize DB] creates the flows database, [Delete DB] drops it, and [Check Status] reports on it. All three print their output in the read-only pane below them● IP Validation – This parameter is frequently used for distinguishing the traffic’s direction (relative to the monitored network)▪ Disabled – Disables IP Validation▪ Enabled – Manually set the parameters below:• IP Zone Inclusion – Select an option:◦ Destination IP AND/OR Source IP – Flow Sensor examines only flows in which the source IP and/or destination IP belongs to the IP Zone. Traffic with a destination IP in the IP Zone is inbound. Traffic with a source IP in the IP Zone is outbound. This simplifies interface configuration (direction can be Auto), but inbound/outbound traffic is considered to be entering/exiting the network, whereas SNMP Sensor and any other SNMP-based tool consider it to be entering/exiting a specific interface◦ Destination IP XOR Source IP – Flow Sensor processes only flows where either the source or the destination IP is in the IP Zone◦ Destination IP NOT Source IP – Flow Sensor processes only flows with a destination IP inside the IP Zone• Log Invalidated Flows – Set to Every 10 ticks to have the event log show the percentage of invalidated flows and a list of ten flows that fail IP validation. Set to Never to log nothing● AS Validation – BGP-enabled routers can export flows that contain the source and destination ASN (Autonomous System Number). In most cases, if the AS number is set to 0, then the IP address belongs to the local ASN. This option is rarely used for establishing traffic direction▪ Disabled – Disables AS validation▪ Enabled – Manually set the parameters below:• Local AS List – Enter your AS numbers, separated by spaces• Local AS Inclusion – Select Destination AS AND/OR Source AS to process the flows in which either or both ASNs are in the Local AS List, or Destination AS XOR Source AS to process only the flows in which exactly one of them is• Log Invalidated Flows – Set to Every 10 ticks to have the event log show the percentage of invalidated flows and a list of ten flows that fail AS validation. Set to Never to log nothing● Time Zone – Indicate the offset between the Flow Sensor server’s time zone and that of the flow exporter, from Exporter TZ -23 hours, through Same as Exporter, to Exporter TZ +23 hours. It’s crucial to run NTP on both devices to keep their clocks in sync• Minutes Offset – Time zones that are not a whole number of hours need the extra 30 minutes offered by the options button. Leave it on 0 minutes otherwise. The button is grayed out while the Time Zone is Same as Exporter● Performance – Adjust how aggressively the Flow Sensor uses system resources:▪ Conservative – Sensor Granularity set to 30 seconds; Anomaly Granularity set to 30 seconds; Anomaly Threads set to 1; Interface Threads set to 1▪ Balanced – Sensor Granularity set to 20 seconds; Anomaly Granularity set to 1 second; Anomaly Threads set to 1; an Interface Thread for every 10 interfaces▪ Custom – Manually set the parameters below:• Sensor Granularity – Lower values improve Sensor graph accuracy but consume more RAM. Choose a value between 5 seconds and 1 minute; the default 20-second interval is recommended for most setups• Anomaly Granularity – How often to check for new anomalies: Same as Sensor Granularity, 1 second, 2 seconds, or 5 seconds. With a value lower than the Sensor Granularity, the checks made between two interval ends also evaluate the interval in progress against the over-threshold rules of individual IPs. Its traffic so far is averaged over the whole interval, so an anomaly is reported as soon as the interval is certain to exceed the threshold: after a few seconds for an attack several times above the threshold, at the end of the interval for one just above it. With sFlow, which has no flow delay, this is what lets a strong attack be detected before the interval ends. The interval in progress is not evaluated on a Sensor where Sweep Merge is in use, because a sweep can only be merged when its sub-anomalies and the covering anomaly are detected in the same check. Lower values detect anomalies sooner but use more CPU• Anomaly Threads – Number of parallel threads dedicated to anomaly processing, up to 255. Each thread maintains a dedicated SQL connection. Leave it on Auto to let the Flow Sensor decide• Interface Threads – How many threads to use when analyzing interface data, up to 100. Each thread maintains a dedicated SQL connection. Leave it on Auto to use one thread for every 10 interfacesAnomaly Granularity and Anomaly Threads are absent when the Sensor License is set to Wansight● Monitored Interfaces – This grid lists all interfaces to be monitored, showing the Index, Interface Name, Direction, Stats, Speed IN, Speed OUT, and Color of each. To avoid duplicate flow entries, it’s best to add only upstream interfaces. Click [Add Interface] to add interfaces one by one, [Edit Interface] to open the selected one (double-clicking a row does the same), and [Delete Interface(s)] to remove every selected row. Interfaces added or removed here are only written to the database when you click [Save]▪ SNMP Index – Each interface is identified by its SNMP index. If SNMP is configured, Flow Sensor can auto-fill this number from the SNMP-discovered Interfaces grid of the Add Interface window — click a row and its index, name and speeds are copied into the form. Otherwise, retrieve it from the flow exporter and enter it manually▪ Interface Name – Short descriptive name for the monitored interface. Names longer than ten characters may clutter some reports. The colored square inside the field sets the color the interface uses in graphs; the default is random▪ Traffic Direction – Defines how traffic entering the interface relates to your network:• Auto – Recommended in most scenarios. Direction is determined by IP/AS Validation or by the router (if supported in flow data)• Upstream – For peering or internet-facing interfaces• Downstream – For interfaces connected to your own network or customers• Null – Traffic on these interfaces is discarded and thus ignored by Flow Sensor▪ Stats Engine – Determines which traffic tops and AS (Autonomous System) data are collected:• Off – No traffic tops are collected for this interface• Basic – Enables tops for internal IPs (IPs within the IP Zone), IP protocols, TCP/UDP ports, and IP versions• Extended – Includes Basic tops plus upstream ASNs and countries. If the router doesn’t export AS info in flows (e.g., non-BGP router), Flow Sensor uses a GeoIP database that might be slightly outdated. Performance impact is minimal• Full – Includes everything from Extended, plus external IPs (those not in the IP Zone). This setting can significantly increase RAM usage during spoofed attacks with randomized source IPs. It also enables threshold detection for external IPs, and ensures more accurate live AS and country statsThe options button beside Stats Engine is enabled for Extended and Full. It opens Statistics Engine Options (Per Flow Sensor), so the AS Path Detection settings below are shared by every interface of the Flow Sensor rather than set per interface:◦ Refresh Interval – Specifies how often the MRT file is reloaded in RAM. If set to Auto, it reloads whenever modified. If set to Never, it loads only when the Sensor starts. It can also be reloaded Every hour, Every day, Every week, or Every month◦ BGP Dump File – If this field points to a valid BGPd MRT file file, Flow Sensor can show tops and graphs for Transit ASNs◦ BGP Router IPv4/IPv6 – If you’ve specified a BGP Dump File, also enter the next-hop router’s IP address(es). You can find the NEXT_HOP in bgpdump output▪ Connectivity – (Optional) Classifies the interface as Transit, Peering, IX, Private Peering, Customer, Backbone, Access, or Core, and defaults to Undefined. The value can be used as a dimension in the Flow Graphs sub-tab of Reports » Tools » Flows▪ Boundary – (Optional) Marks the interface as External or Internal, and defaults to Undefined. The value can be used as a dimension in the Flow Graphs sub-tab of Reports » Tools » Flows▪ Link Speed In & Link Speed Out – Specify the interface’s bandwidth or capacity. These values enable percentage-based reports and bits/s thresholds● Comments – Enter remarks about the Flow Sensor. These notes are for internal reference only and will not appear elsewhere. The section stays collapsed until it holds text
[Manage Interfaces] configures many interfaces at once by querying the exporter over SNMP, so it reports an error when Exporter SNMP is disabled or incomplete. The Manage Interfaces window lists every interface the exporter knows about, with a Monitor checkbox that decides which ones the Flow Sensor keeps. [Select All Interfaces], [Unselect Interfaces], and [Invert Selection] set that checkbox in bulk, while [Set Traffic Direction] and [Set Stats Engine] apply one value to every row at once.
[Save] writes the configuration. When you remove an interface that a Reports » Dashboards widget, a Sensor Cluster, or a Scheduled Reports entry still refers to, the Console lists those references and asks whether to delete the interface anyway. [Delete] appears only after the Flow Sensor has been saved once, asks for confirmation, and warns in the same way when the Flow Sensor itself is still referenced.
Note
For more details on attack sources detected by Flow Sensor, add a Flow Filter (default parameters are fine) and enable it in the “When an anomaly is detected…” panel of the Response. If the network supports BGP Flowspec, you can also mitigate DDoS attacks directly on the router by configuring a GoBGP Connector or ExaBGP Connector.
18.1. Flow Sensor Troubleshooting
[root@localhost ~]# tcpdump -i <interface_eth0_p1p1_etc> -n -c 100 host <flow_exporter_ip> and udp and port <destination_port>
[root@localhost ~]# ufw status || firewall-cmd --list-all || iptables -L -n -v && iptables -t raw -L -n -v
[root@localhost ~]# ntpq -p || chronyc tracking || timedatectl status
[root@localhost ~]# netstat -s | grep Filter
Received flow <starting/ending> <X> seconds ago, check the following:set forwarding-options sampling instance NETFLOW family inet output inline-jflow flow-export-rate 40
Sensor frozen for <X> seconds. Restarting the collector can have several causes. It is generated when the flow packets are too scarce (1 every few seconds), or when flow packets are not received for tens of seconds (e.g., due to a network outage or router reload). Another cause is a performance issue: the Flow Sensor does not have enough CPU and I/O resources to analyze traffic and send data to the SQL server in a timely manner. In this case, use a physical server instead of a virtual machine, or reduce the IP graphs and IP accounting data that need to be collected in the IP Zone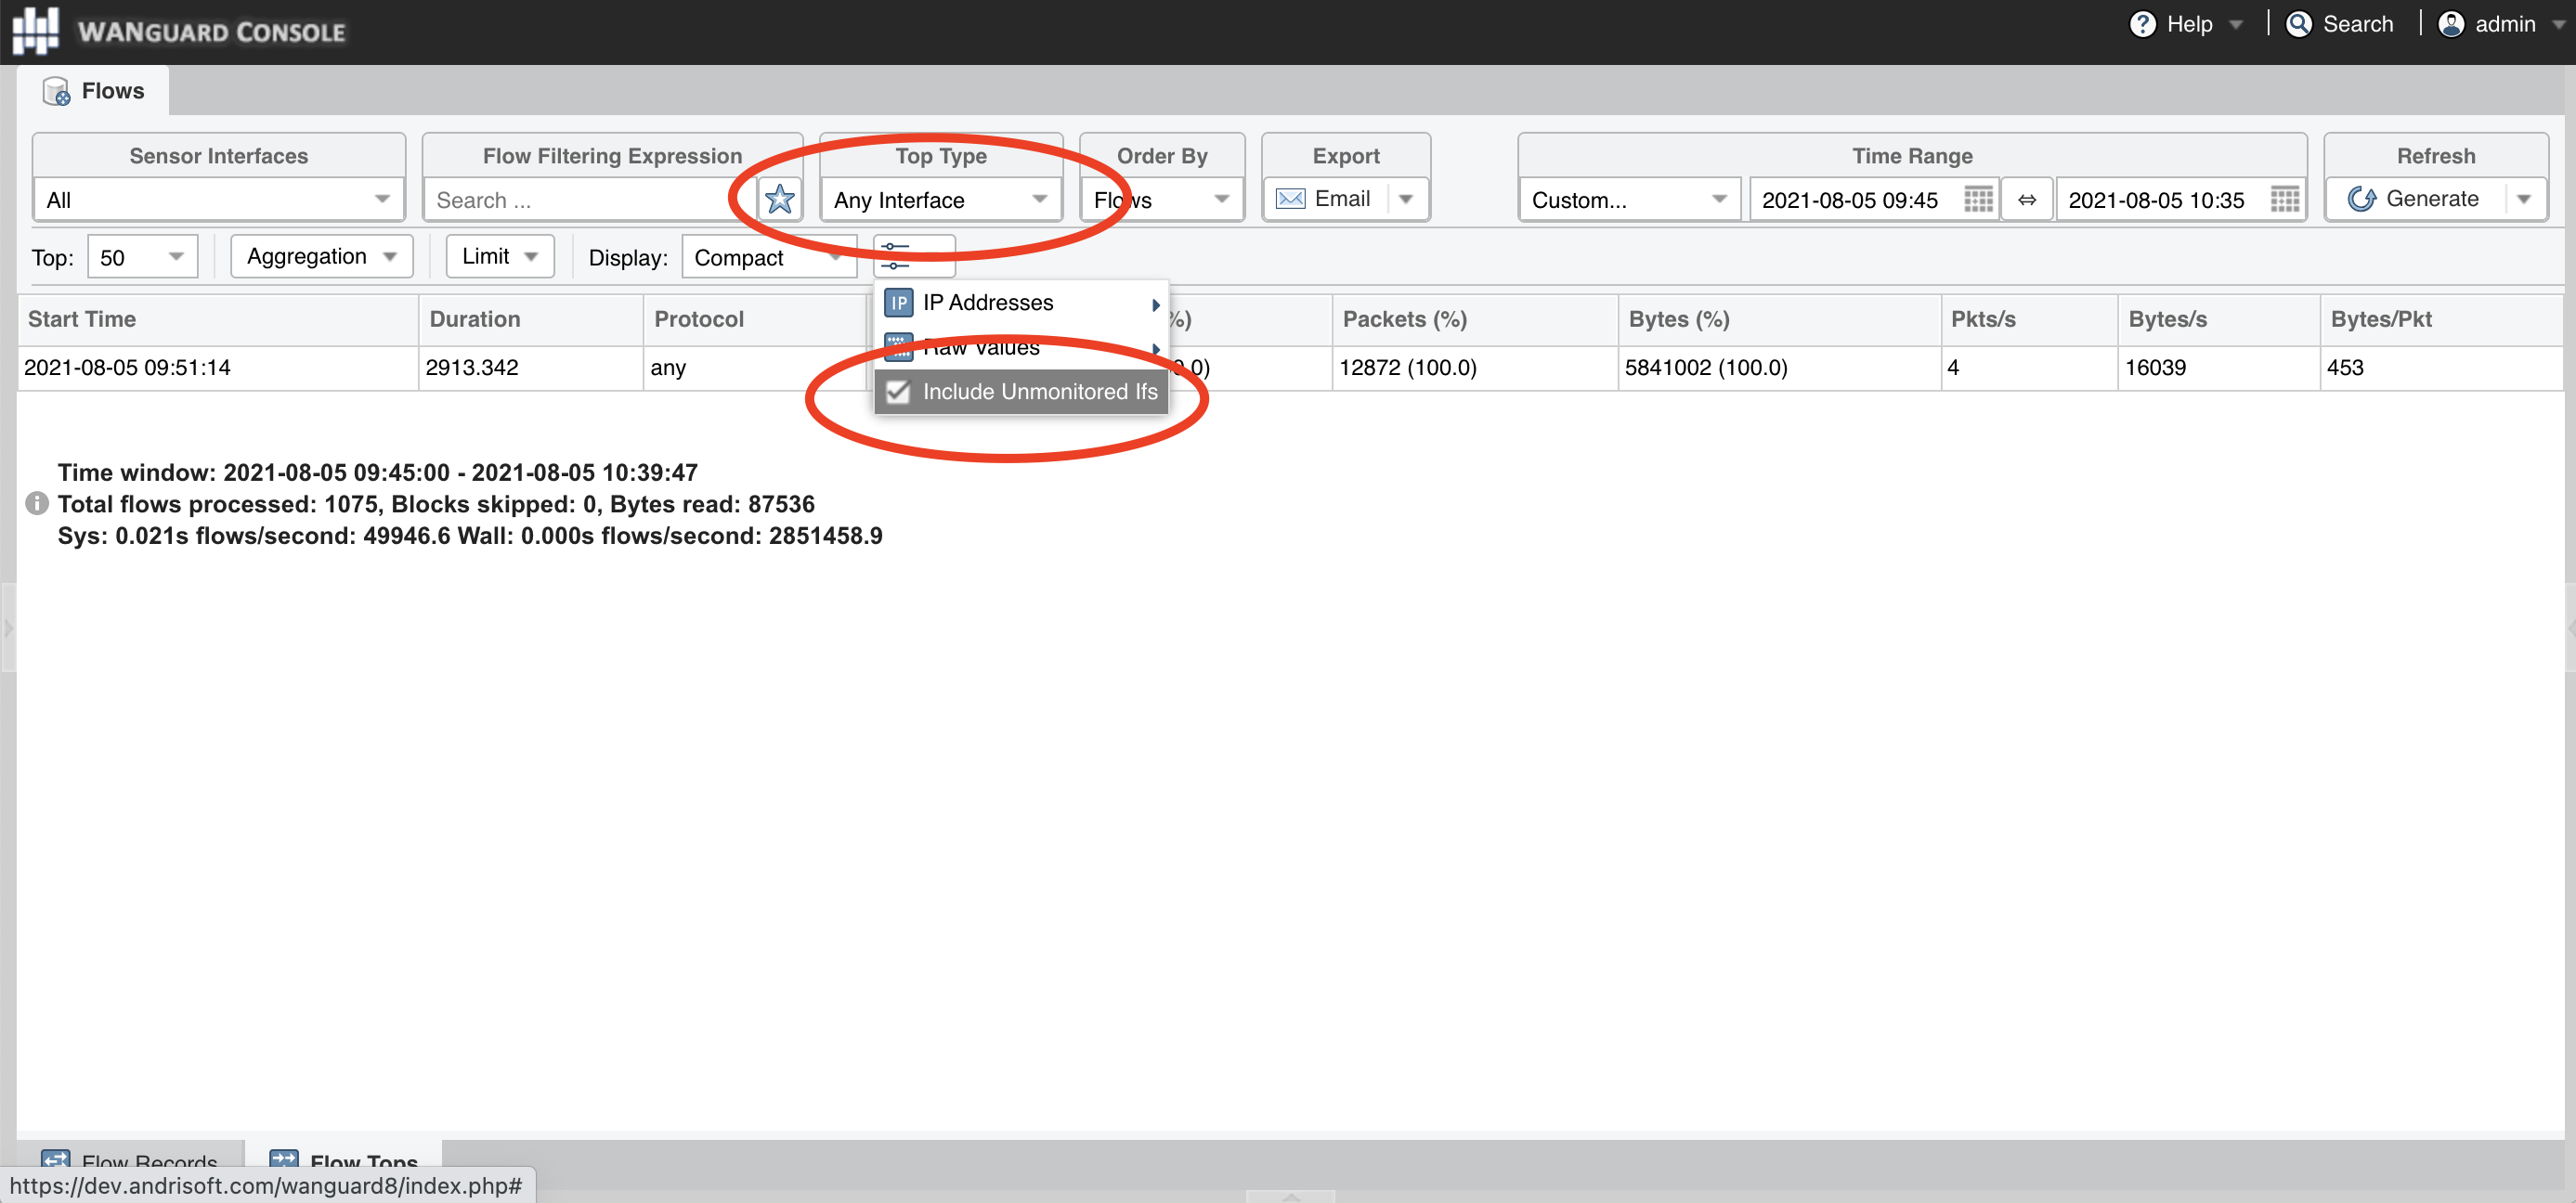
set chassis fpc inline-services flow-table-size ipv4-flow-table-size 15
[root@localhost ~]# tcpdump -i <interface_eth0_p1p1_etc> -s0 -w flows.pcap -c 10000 host <flow_exporter_ip> and udp and port <destination_port>
License key not compatible with the existing server indicates that the server is unregistered and you need to send the string from Configuration » Servers » [Server] » Hardware Key to sales@andrisoft.com