7. Basic Concepts of Wanguard Console
Please read this chapter to understand the essential concepts needed to operate the user interface correctly. The following chapters cover software configuration, and the final chapters describe the reporting features.
7.1. User Interface Structure
To use the Console web interface effectively, it helps to understand its structure:
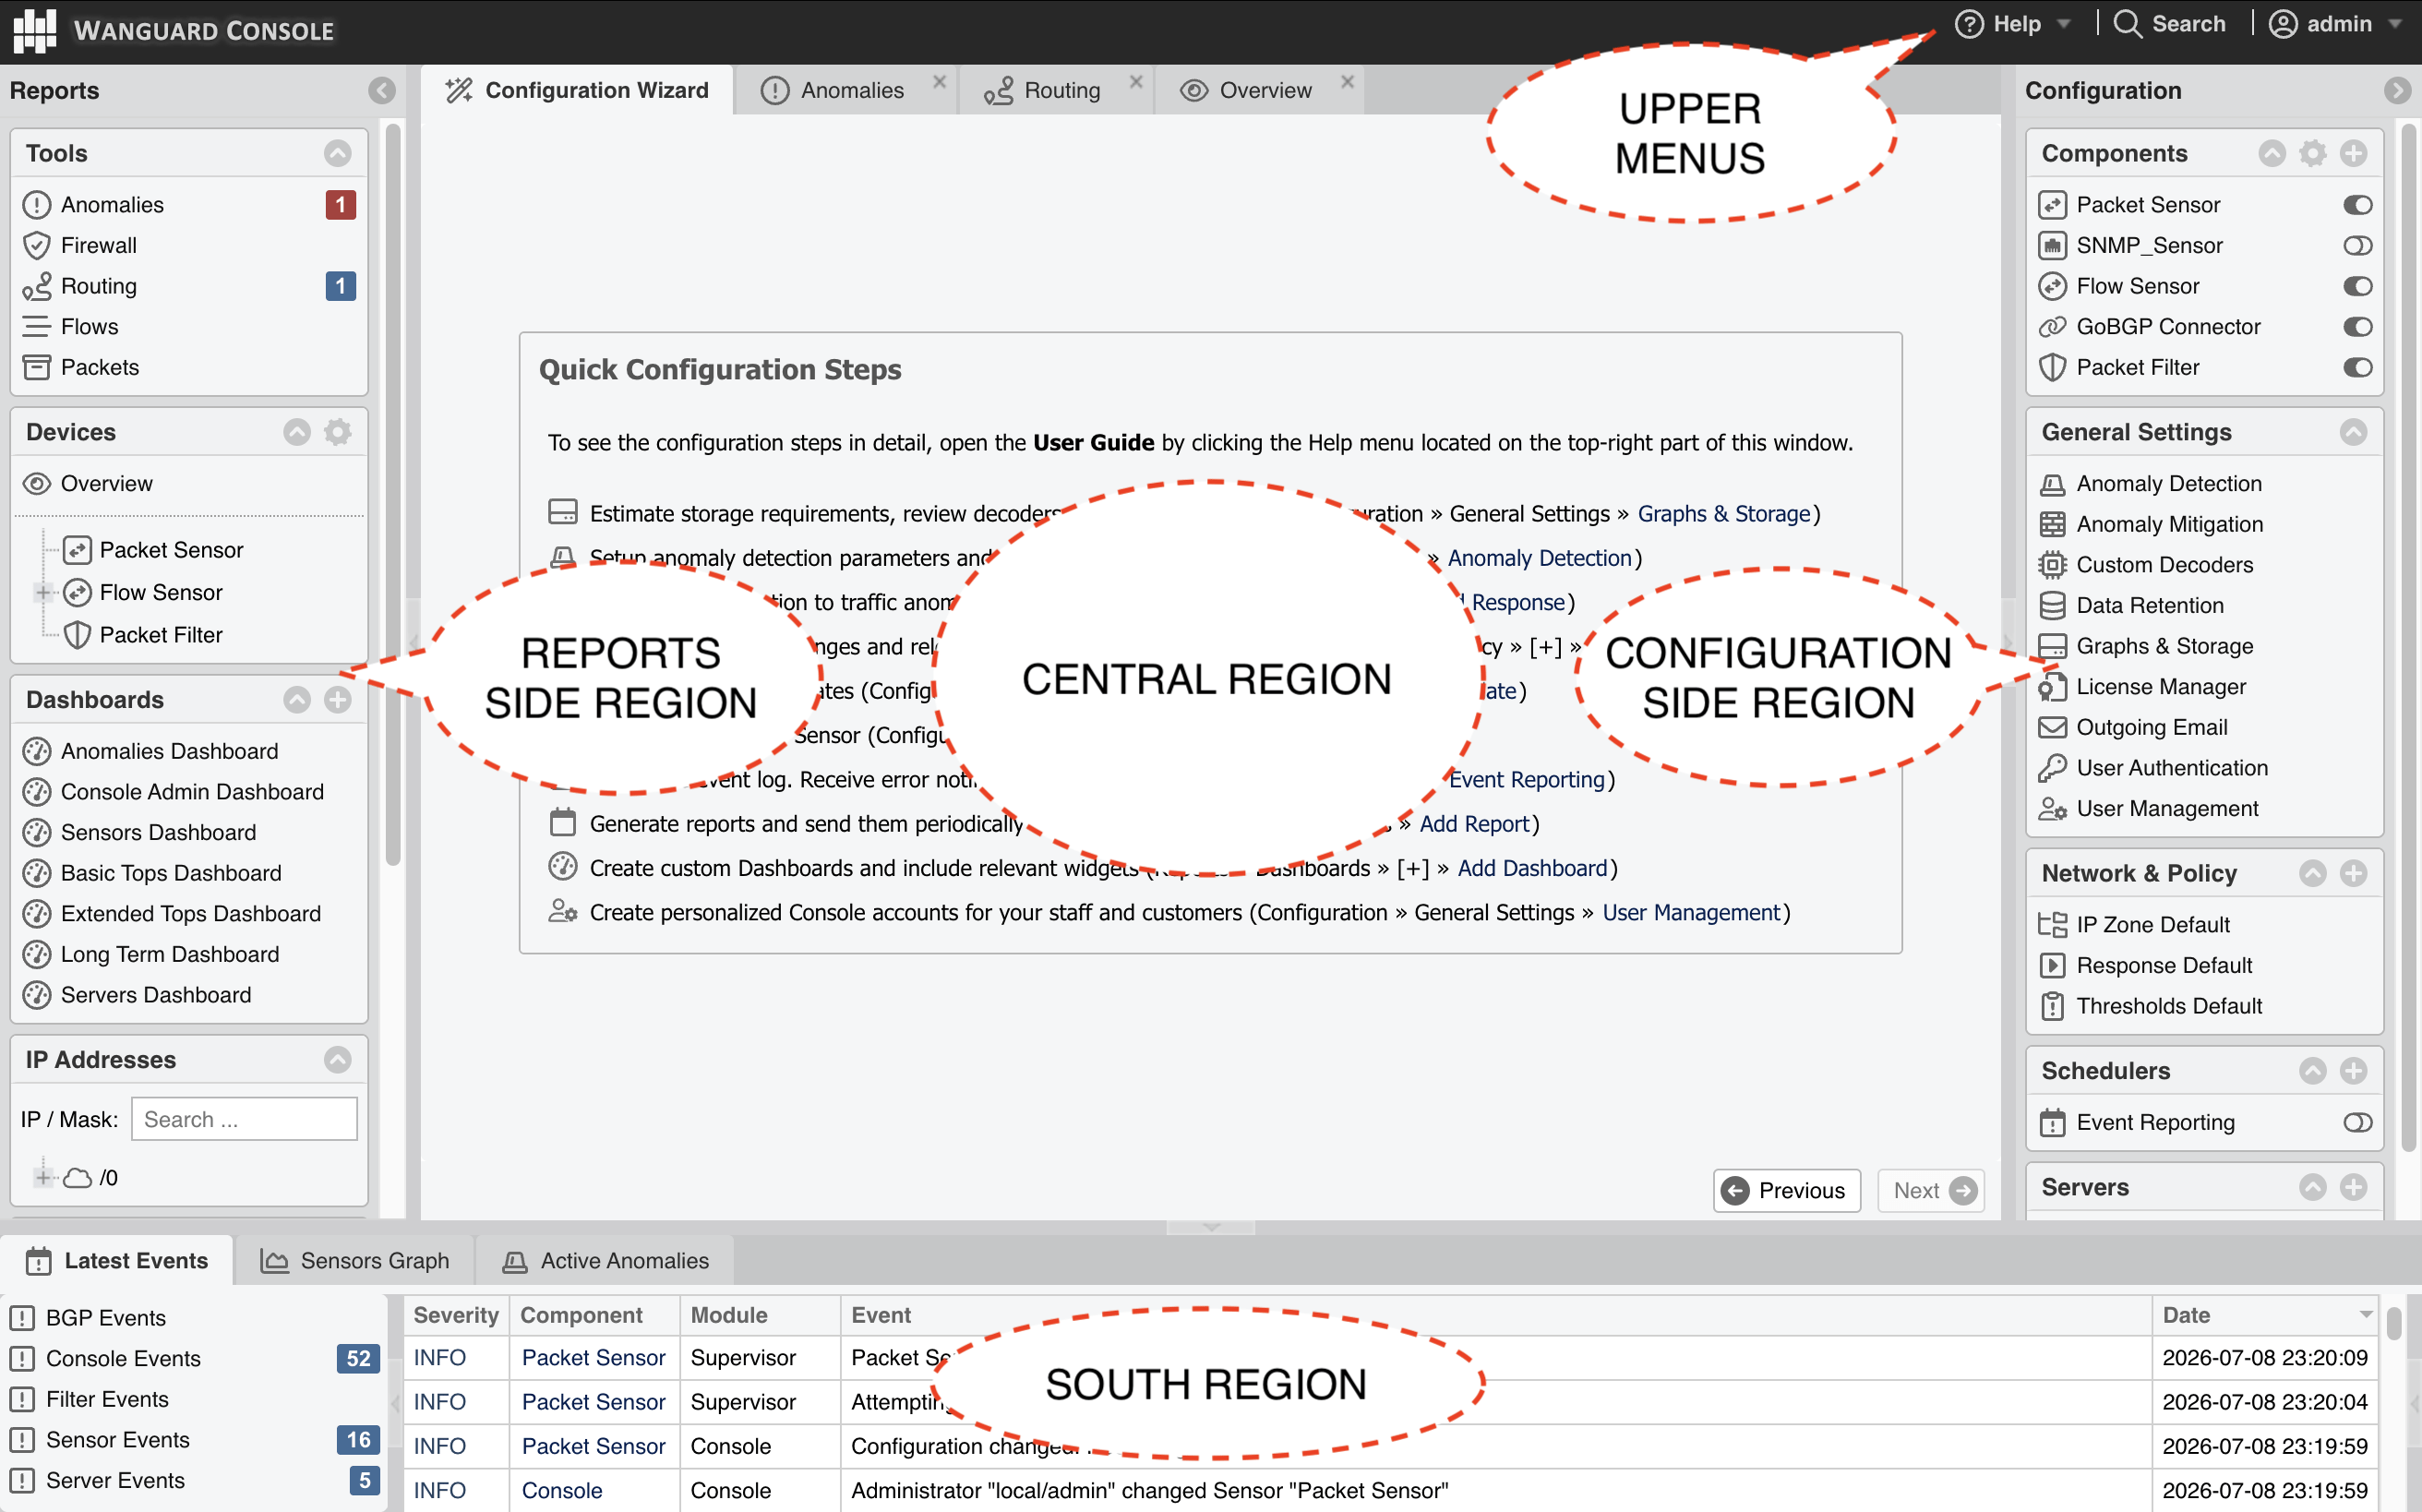
7.1.1. Side Region
The Side Region consists of two independently dockable regions—Reports and Configuration. From User menu » Console Layout, each one can be docked to either the west (left) or the east (right) edge of the browser window. When both are docked to the same edge they stack as two collapsible sections within a single side panel, which you expand or collapse by clicking their title bars; when they are docked to opposite edges, each region occupies its own edge.
If a region is not visible, it may simply be collapsed, or an administrator may have hidden it for your role—see General Settings » User Management. Clicking the border of a region expands or collapses it, and pressing Ctrl+R cycles the Reports and Configuration regions through their expanded and collapsed states.
Each region contains multiple panels that can also be collapsed or expanded; their state is maintained between sessions. These panels update in real time, and most allow you to add objects by clicking the [+] button in the panel’s title bar.
7.1.2. Central Region
Each report, dashboard, or tool you select in the Side Region opens in a new tab (page) within the Central Region. You can switch between tabs (and sub-tabs) using your mouse or by pressing (Alt+)Ctrl+→ and (Alt+)Ctrl+←. You can close all tabs except for the Landing Tab, which is initially set to the Configuration Wizard. To change the Landing Tab, edit your user profile in General Settings » User Management—it can be pointed at the Welcome tab, a dashboard, a device group, an IP Group or IP address, or a component or tool tab. You can also drag and drop tabs and sub-tabs to rearrange them.
7.1.3. South Region
The South Region offers quick access to the Latest Events tab, a live traffic graph, or a list of active anomalies. It is located at the bottom of the browser window. By default, it is collapsed; to expand it, click the thin line near the lower edge or press Ctrl+E. An administrator can hide the South Region for your role—see General Settings » User Management.
Events are brief text messages describing errors, warnings, or changes in operational status. Each Wanguard software component generates its own events, which are then logged and centralized in the Console database.
The Latest Events tab displays the 50 most recent events. It also shows a list of components capable of generating events, along with the number of events each component generated in the last 24 hours. Collapsible side panels let you filter the tab by component and minimum severity, and set its refresh interval. The color of the number indicates the highest severity among those events:
● CRITICAL – Generated when significant errors occur, such as memory exhaustion● ERROR – Commonly caused by misconfiguration, communication errors between components, or bugs. Sensors may auto-recover from some errors by restarting● WARNING – Triggered by authentication failures, I/O bottlenecks, or time synchronization problems● INFO – Logged when configurations change or when users log in● DEBUG – Used for troubleshooting or for development purposes
You can also view events per software component by navigating to Reports » Devices » [Component Name] » [Component Type] Events sub-tab. To search, sort, or filter event messages, click the small down arrow that appears when you hover over the Event column header. For more details about a specific event, click the [+] button in the first column.
7.2. Keyboard Shortcuts
The Console provides the following global keyboard shortcuts:
● Ctrl+S – Opens the Quick Search window● Ctrl+R – Cycles the Reports and Configuration regions through their expanded and collapsed states● Ctrl+E – Expands or collapses the South Region● Ctrl+← and Ctrl+→ – Switch to the previous or the next tab● Alt+Ctrl+← and Alt+Ctrl+→ – Switch to the previous or the next sub-tab