17. Components » Packet Sensor
Packet Sensor inspects every received packet to perform packet-based traffic analysis. For more details on packet-based vs. flow-based monitoring, see the Choosing a Method of Traffic Monitoring chapter.
In switched networks, only packets destined for a specific device reach that device’s network interface. If the Packet Sensor’s server is not inline in the primary data path, use a network TAP or a switch/router with a monitoring (or mirroring) port. This setup copies data packets from selected ports or VLANs to the monitoring port.
To add a Packet Sensor, click the [+] button from the title bar of the Configuration » Components panel. To modify an existing Packet Sensor, go to Configuration » Components and click its name.
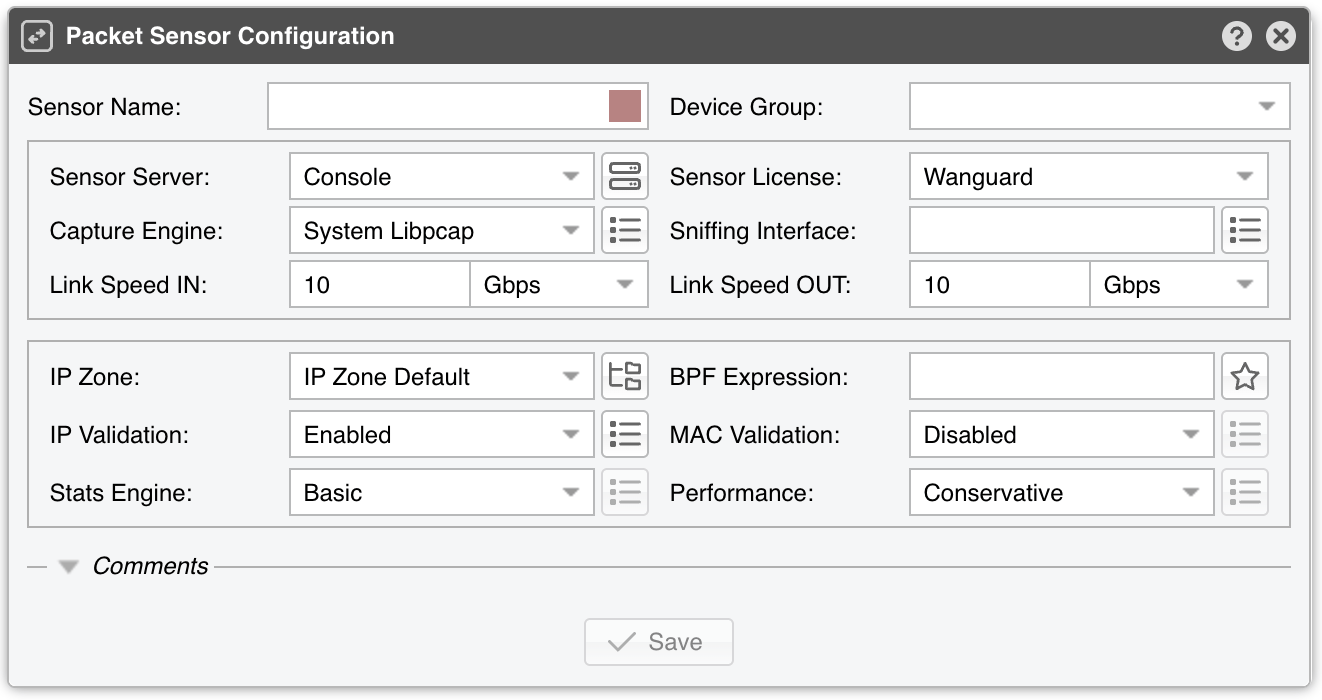
The Packet Sensor Configuration window opens on a form whose Sensor Name, Sensor Server and IP Zone are mandatory: [Save] stays grayed out until the three of them are filled in. The Sniffing Interface is verified when you save, and it is required by every capture engine except DPDK.
Packet Sensor Configuration parameters:
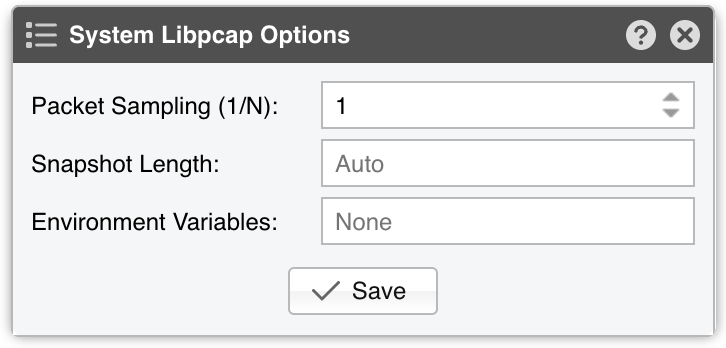
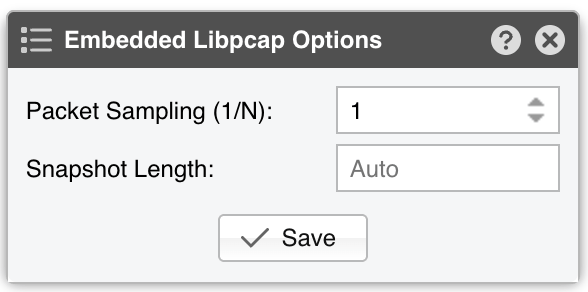
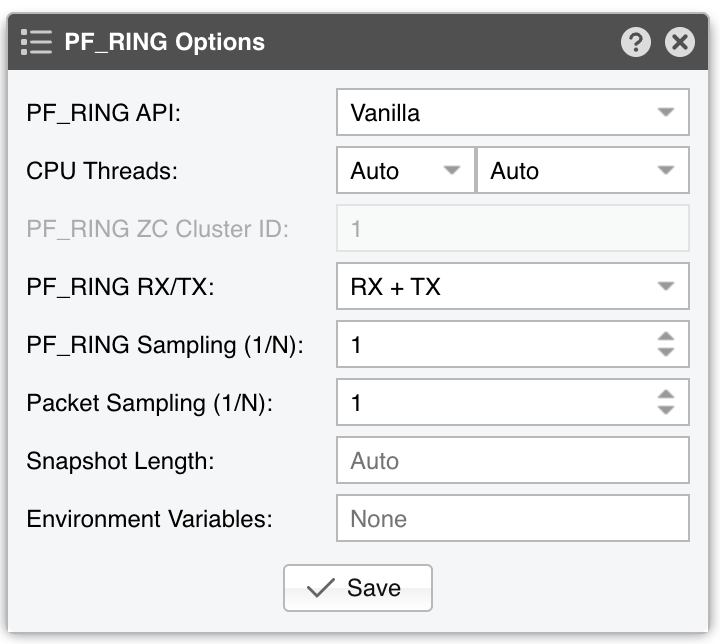
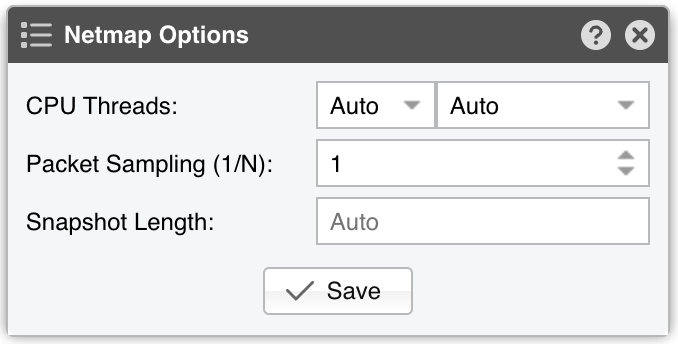
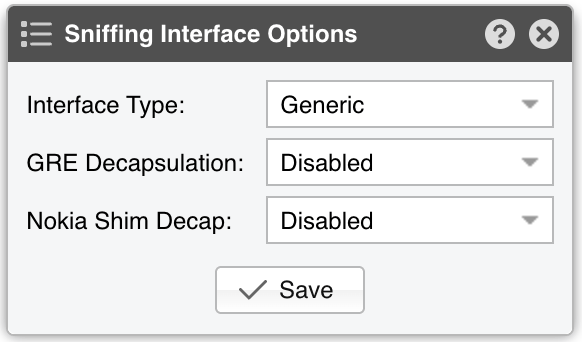
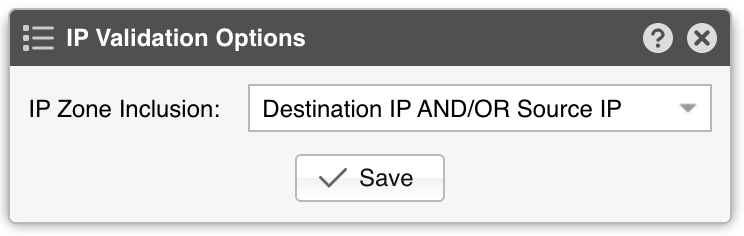
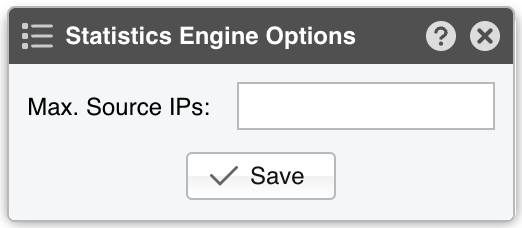
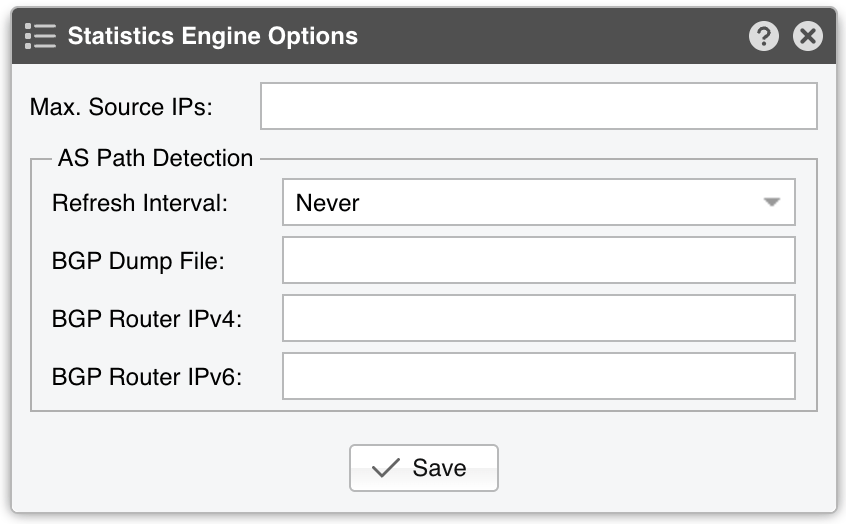
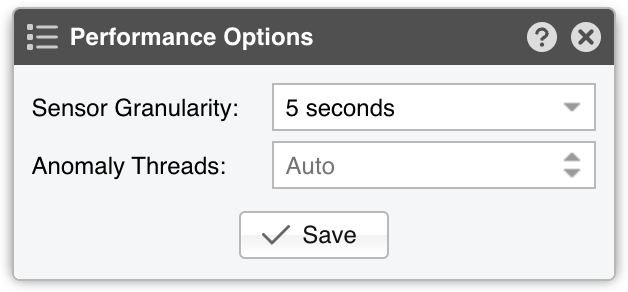
● Sensor Name – A short name to help you identify the Packet Sensor. The colored square inside the field sets the color used by the Packet Sensor in graphs; the default is random● Device Group – Enter a label if you want to group components (e.g., by location or characteristics) or control role-based access. The combo box is editable, so you can type a new group instead of selecting an existing one● Sensor Server – Select a server that meets the minimum system requirements for the Packet Sensor. If this is not the Console server, follow the NFS configuration steps to ensure the raw packet data is visible in the web interface. The button on the right opens the configuration of the selected server● Sensor License – The license used by the Packet Sensor. Wanguard provides all features; Wansight excludes traffic anomaly detection and reaction, so it also hides the Anomaly Threads option● Capture Engine – Choose the preferred packet capturing engine, then click the button on its right to set the options it provides:▪ System Libpcap – Select to use the libpcap library provided by the Linux distribution. This is the default engine. Libpcap requires no additional setup, but it cannot run on multiple threads, and it may be too slow for multi-gigabit sniffing• Packet Sampling (1/N) – Must contain the packet sampling rate, between 1 and 100,000. On most systems, the correct value is 1• Snapshot Length – Sniff <number> bytes of data from each packet rather than the whole packet. Leave it empty (Auto) to capture whole packets• Environment Variables – Some NIC drivers provide their own libpcap but require an environment variable to be set▪ Embedded Libpcap – Select to use the built-in libpcap library• Packet Sampling (1/N) – The sampling rate, between 1 and 100,000. On most systems, the correct value is 1• Snapshot Length – Sniff <number> bytes of data from each packet rather than the whole packet. Leave it empty (Auto) to capture whole packets▪ PF_RING – Select to use the PF_RING framework to speed up packet processing. PF_RING is much faster than Libpcap, but it requires the installation of additional kernel modules and supports only a limited number of NICs• PF_RING API – Select Vanilla, Multichannel, or ZC. PF_RING ZC is faster than “vanilla” PF_RING, but it requires purchasing a ZC license from ntop.org. When an interface enters PF_RING ZC mode, it is no longer available to the OS for other operations such as capturing packets, routing or switching. Multichannel should be used with Mellanox NICs even when a ZC license is active. The licensing can be checked withpfcount -L -v1• CPU Threads – Packet Sensor can run multi-threaded on a given set of CPU cores. Select Auto, or a thread count between 1 and 64. Each thread increases the RAM usage. The combo box next to it pins the threads to a set of CPU cores, either Auto or any combination of Core 0 through Core 63• PF_RING ZC Cluster ID – The cluster identifier used by the ZC API. It can only be edited when the PF_RING API is set to ZC• PF_RING RX/TX – PF_RING can consider only those packets matching the specified direction: RX, TX, or RX + TX• PF_RING Sampling (1/N) – PF_RING can sample packets directly in the kernel, which is much more efficient than doing it in user-space• Packet Sampling (1/N) – Must contain the packet sampling rate, between 1 and 100,000. On most systems, the correct value is 1• Snapshot Length – Sniff <number> bytes of data from each packet rather than the whole packet. Leave it empty (Auto) to capture whole packets• Environment Variables – A few PF_RING internal parameters can be set using environment variables▪ Netmap – Select to use the Netmap framework to speed up packet processing. Netmap requires the installation of additional kernel modules, and it only supports a limited number of NICs. When an interface enters Netmap mode, it is no longer available to the OS for other operations such as routing or switching• CPU Threads – Packet Sensor can run multi-threaded on a given set of CPU cores. Select Auto, or a thread count between 1 and 24. Each thread increases the RAM usage, and on most systems, activating more than 6 CPU threads hurts performance. The combo box next to it pins the threads to a set of CPU cores• Packet Sampling (1/N) – Must contain the packet sampling rate, between 1 and 100,000. On most systems, the correct value is 1• Snapshot Length – Sniff <number> bytes of data from each packet rather than the whole packet. Leave it empty (Auto) to capture whole packets▪ DPDK – Select to use the DPDK framework, then click the button on the right of the Capture Engine field to configure DPDK-specific parameters as described in Appendix 1. DPDK takes its ports, Interface Type, GRE Decapsulation and VXLAN Decapsulation from that window, so the Sniffing Interface and the BPF Expression fields are grayed out● Sniffing Interface – Specifies which network interface(s) the Packet Sensor monitors. Libpcap accepts only a single interface, whereas PF_RING can listen to multiple physical interfaces simultaneously if they’re separated by a comma (,)• Interface Type – Leave it on Generic, or select TUN/TAP or GRE when the Sniffing Interface is one of those• GRE Decapsulation – When Enabled, Packet Sensor will analyze the inner packet rather than the GRE header• VXLAN Decapsulation – When Enabled, Packet Sensor will analyze the inner packet rather than the VXLAN header• Nokia Shim Decap – When Enabled, Packet Sensor decapsulates traffic mirrored by Nokia SR OS routers using ip-udp-shim encapsulation and analyzes the inner packet• Nokia Shim Port – The UDP port used by the Nokia ip-udp-shim mirror service. It is shown, and required, only while Nokia Shim Decap is Enabled● Link Speed IN / OUT – Enter the capacity or bandwidth of the monitored link. These values are used for percentage-based reports and bits/s thresholds● IP Zone – Packet Sensor needs an IP Zone from which to learn the network’s boundaries and to extract per-subnet settings. The button on the right opens the selected IP Zone● BPF Expression – You can use this parameter to filter the type of traffic received by the Packet Sensor. The star button opens Bookmarks & Syntax Help, which documents the tcpdump-style syntax and keeps the expressions you use often● IP Validation – The most common way to determine whether packets belong to your network:▪ Disabled – Packet Sensor analyzes all traffic and uses MAC Validation to identify the direction of traffic▪ Enabled – Packet Sensor uses IP Validation to identify the direction of traffic• IP Zone Inclusion – Select an option:◦ Destination IP AND/OR Source IP – Packet Sensor analyzes the traffic that has the source and/or the destination IP in the selected IP Zone. This is the default value and the recommended one for most configurations◦ Destination IP XOR Source IP – Packet Sensor analyzes the traffic that has either the source or the destination IP in the selected IP Zone◦ Destination IP NOT Source IP – Packet Sensor analyzes the traffic that has the destination IP in the selected IP Zone, but not the source IP● MAC Validation – This rarely-used option can be used to distinguish the direction of the packets or to ignore unwanted OSI Layer 2 traffic:▪ Disabled – Packet Sensor analyzes all traffic and uses IP Validation to identify the direction of traffic▪ Upstream MAC – MAC validation is active, and the MAC Address belongs to the upstream router▪ Downstream MAC – MAC validation is active, and the MAC Address belongs to the downstream router• MAC Address – Enter the MAC address of the upstream or downstream router in Linux convention: six pairs of hex digits separated by colons (:). It is mandatory for both options● Stats Engine – Collects traffic tops and AS graphs:▪ Disabled – No traffic tops are collected▪ Basic – Enables tops for internal IPs, IP protocols, IP versions, and TCP/UDP ports. It adds a minimal performance penalty, so it’s the recommended value on most systems▪ Extended – Enables the tops from Basic as well as tops for external IPs (IPs not included in the IP Zone). It adds a performance penalty of over 20%, especially during spoofed attacks with randomized sources. It permits the detection of threshold violations for external IPs• Max. Source IPs – Can limit the amount of RAM used to keep track of external IPs, or prevent interruptions during very powerful attacks from randomized sources. A new Packet Sensor starts with a limit of 1,000,000 source IPs▪ Full – Enables the tops from Extended as well as tops and graphs for autonomous systems. It adds a performance penalty of over 20%, especially during spoofed attacks with randomized sources. It permits the detection of threshold violations for external IPs• Max. Source IPs – Can limit the amount of RAM used to keep track of external IPs, or prevent interruptions during very powerful attacks from randomized sources. A new Packet Sensor starts with a limit of 1,000,000 source IPs• Refresh Interval – Set how often the MRT file should be reloaded in RAM. If it is set to Auto, then the file will be refreshed every time it is modified. If it is set to Never, the file will only be loaded when the Sensor starts. The remaining options reload it Every hour, Every day, Every week, or Every month• BGP Dump File – Enter the path to a file exported by BGPd in MRT format to enable tops and graphs for Transit ASNs• BGP Router IPv4 / IPv6 – If the MRT file is specified, also provide the IPv4 and/or IPv6 address of the next-hop router. You can find this address in the NEXT_HOP field from the bgpdump output● Performance – Adjust how aggressively the Packet Sensor uses system resources:▪ Conservative – Single anomaly-processing thread; Sensor Granularity set to 5 seconds▪ Balanced – Up to 128 anomaly-processing threads; Sensor Granularity set to 5 seconds▪ Custom – Manually set the parameters below:• Sensor Granularity – Interval between successive updates of traffic statistics and anomaly checks, either 5 seconds or 1 second. 1 second ensures the fastest detection but also the highest database load• Anomaly Threads – Number of parallel threads dedicated to anomaly processing, up to 255. Leave it on Auto to allocate up to 128 threads automatically. Each thread maintains a dedicated SQL connection. The field is absent when the Sensor License is set to Wansight● Comments – Comments about the Packet Sensor can be saved here. They are not visible elsewhere. The section stays collapsed until it holds text
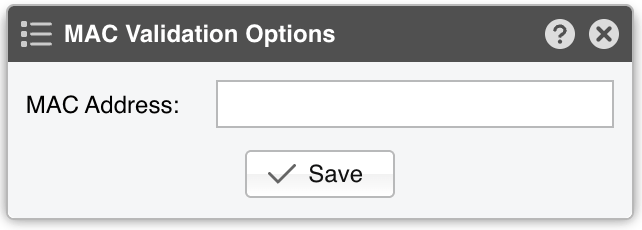
IP Validation and MAC Validation each establish the direction of the traffic, so at least one of them has to be active. Saving a Packet Sensor that has both set to Disabled is refused, and so is one whose MAC Validation is active but whose MAC Address is empty.
[Save] stores the configuration. [Delete] appears only after the Packet Sensor has been saved once, and it asks for confirmation. A Packet Sensor that is still used by a Reports » Dashboards widget, by a Sensor Cluster, or by a Scheduled Reports entry cannot be deleted; the Console names what still refers to it.
A Packet Sensor that still detects active anomalies cannot be deleted either — wait until no anomaly is active, or stop them manually. Deleting a Packet Sensor while it runs stops it first.
Note
To gather more details on the attack sources seen by Packet Sensor, add a Packet Filter using the same Sniffing Interface and Capture Engine, then enable it in the “When an anomaly is detected…” panel of the Response configuration.
17.1. Packet Sensor Troubleshooting
License key not compatible with the existing server indicates that the server is unregistered and you need to send the string from Configuration » Servers » [Server] » Hardware Key to sales@andrisoft.com[root@localhost ~]# ip link show <interface>
[root@localhost ~]# tcpdump -i <interface_usually_eth1_or_p1p2> -n -c 100
17.2. Optimization Steps for Intel XL710
To distribute the packet-processing tasks of the Packet Sensor over multiple CPU cores when using the Intel XL710 adapter and a ZC license:
17.3. Optimization Steps for Intel 82599
To distribute the packet-processing tasks of the Packet Sensor over multiple CPU cores when using an adapter with the Intel 82599 chipset (Intel X520, Intel X540, HP X560, etc.):