18. Components » SNMP Sensor
SNMP Sensor monitors the bandwidth usage of SNMP-enabled devices — such as routers, switches, or servers — by querying each port’s traffic counters. These queries prompt reply packets from the monitored device. For more on the pros and cons of SNMP-based monitoring, see the Choosing a Method of Traffic Monitoring section.
To add an SNMP Sensor click the [+] button from the title bar of the Configuration » Components panel. To modify an existing one, select it from Configuration » Components.
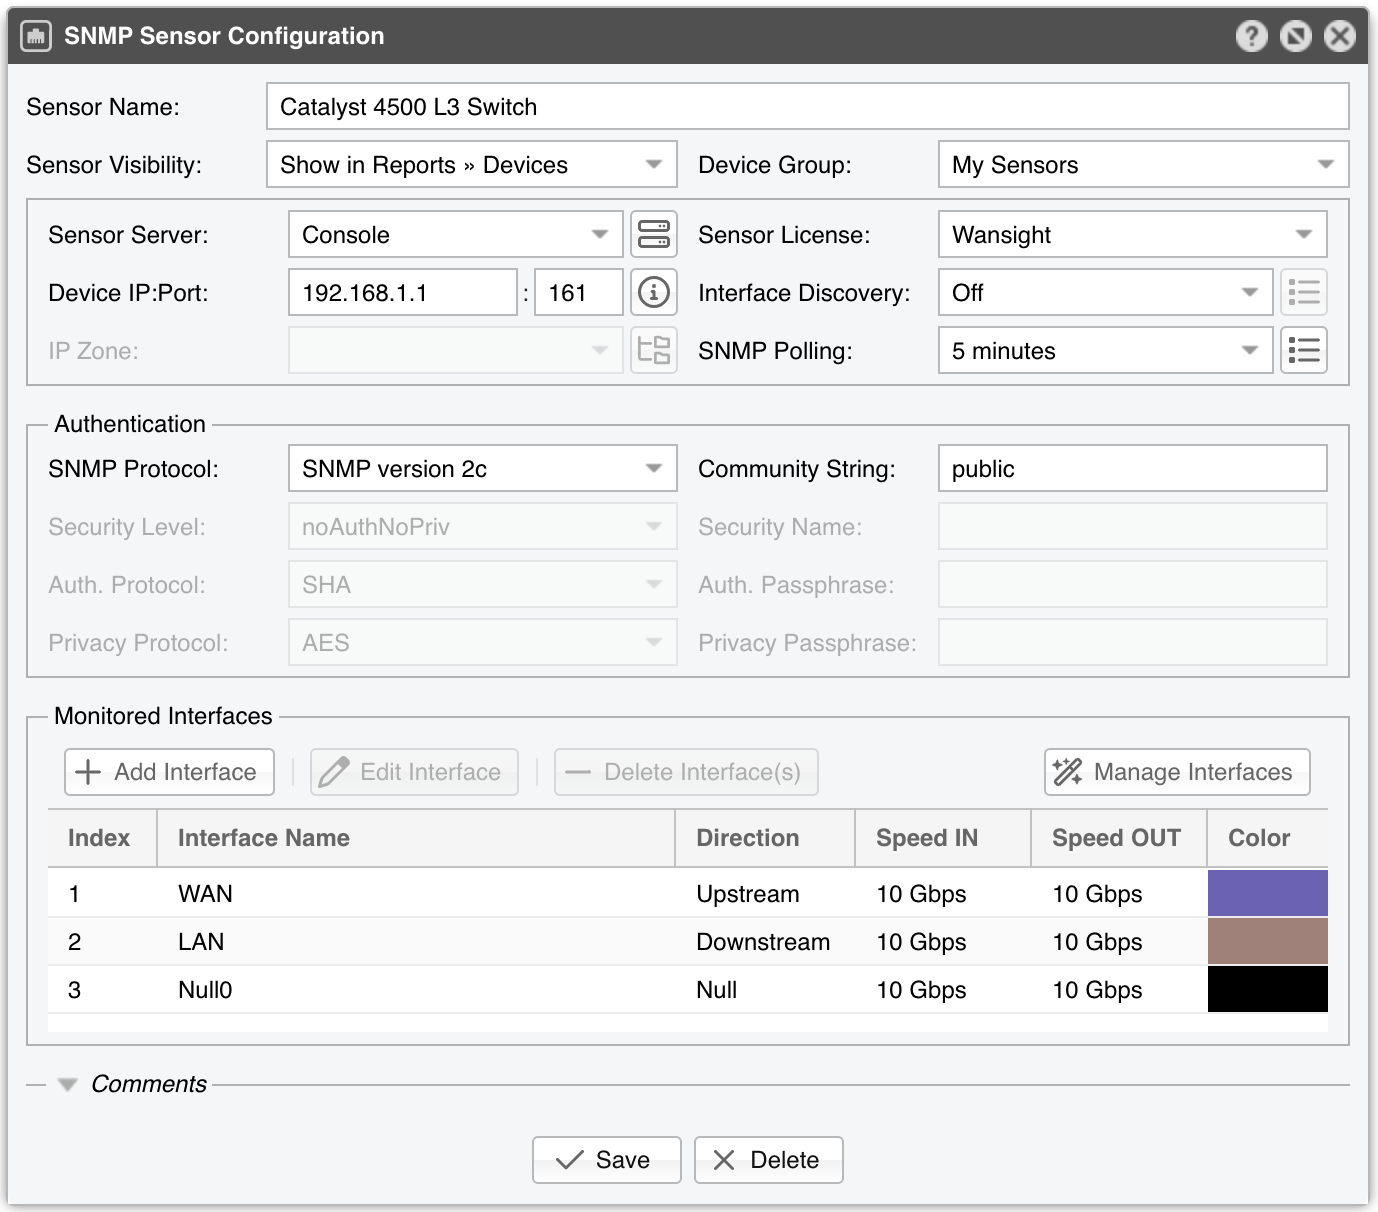
SNMP Sensor Configuration parameters:
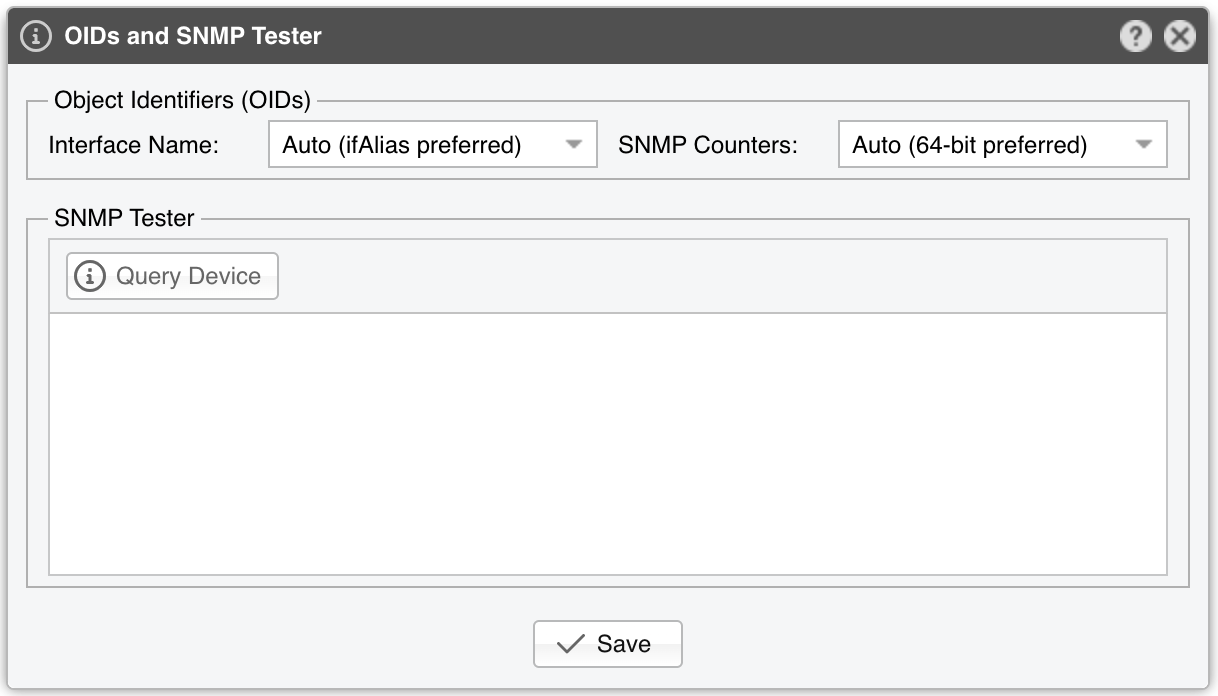
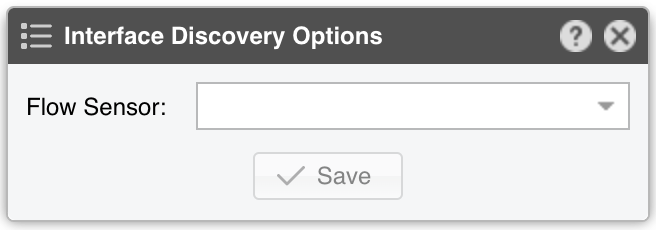
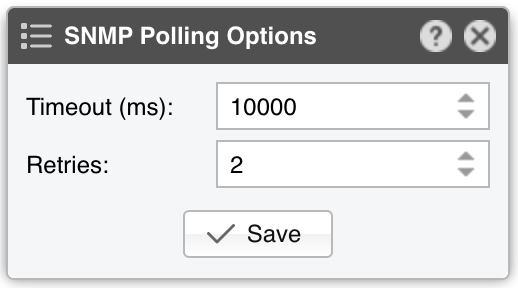
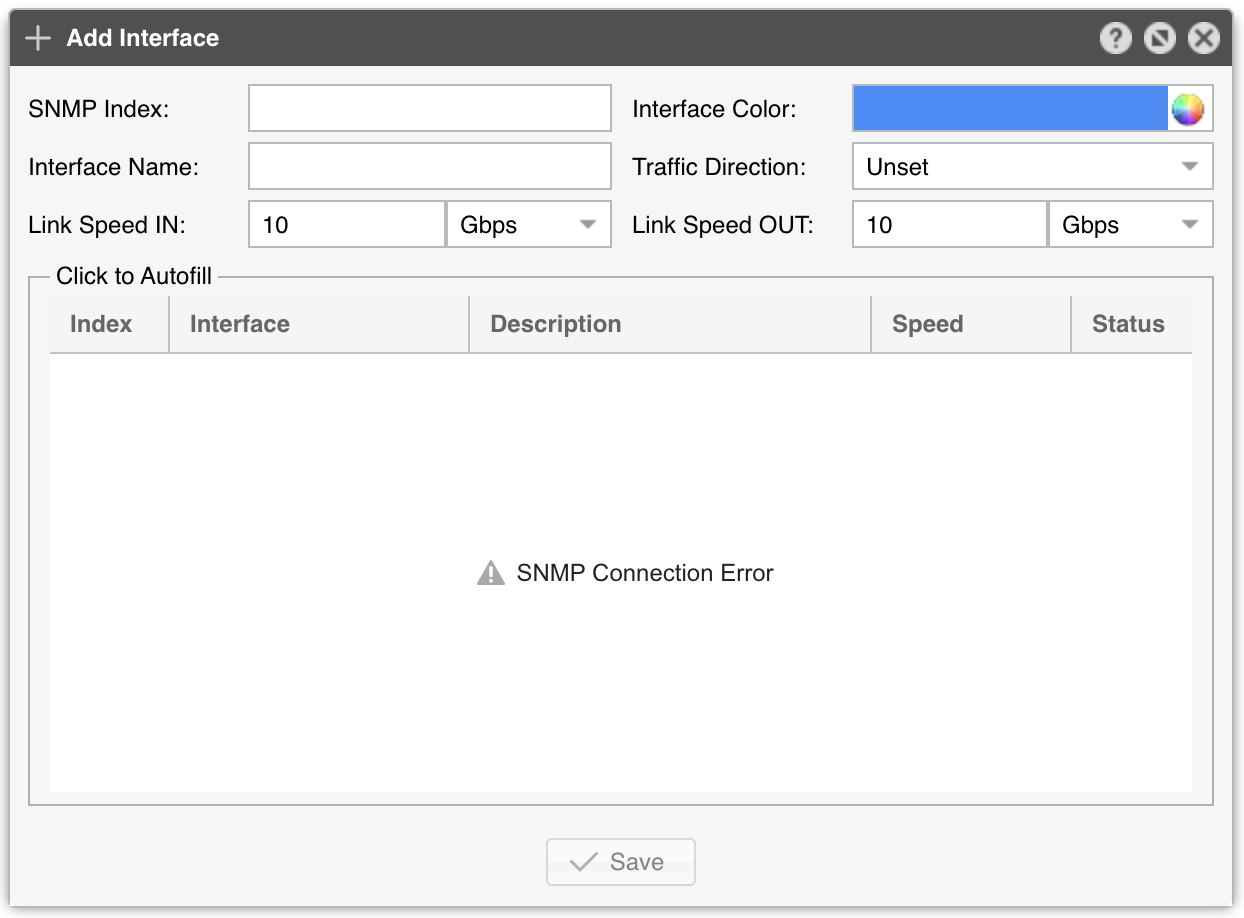
● Sensor Name – A short name to identify the SNMP Sensor● Sensor Visibility – Toggles whether the SNMP Sensor appears in Reports » Devices● Device Group – Enter a description for organizational or role-based access purposes (e.g., location, characteristics)● Sensor Server – Select a server that meets the minimum system requirements for running an SNMP Sensor● Sensor License – The SNMP Sensor uses a Wanguard or Wansight license. While Wanguard supports all features, the limited Layer 3+ visibility of SNMP restricts most capabilities. Wansight excludes anomaly detection and reaction● Device IP:Port – Enter the IP address of the networking device and specify the SNMP port (default 161/UDP). Click the button to the left to test the connection• Interfaces – Determines how interface names are imported automatically• SNMP Counters – Choose 32-bit only if your device doesn’t support 64-bit counters● Interface Discovery – Manages the interface discovery feature:▪ Off – Monitors only the interfaces you add manually to the Monitored Interfaces grid▪ Auto-discover interfaces – Automatically imports all interfaces, which can clutter the Console with many unnecessary entries. This is not recommended▪ Import from Flow Sensor – Populates the Monitored Interfaces grid with interfaces from an existing Flow Sensor. Click the options button to choose from which Flow Sensor to import the interface data● IP Zone – When using a Wanguard license, SNMP Sensor can evaluate threshold rules from the chosen IP Zone. Because SNMP lacks IP-level detail, the only applicable threshold rule must have:◦ Prefix set to 0.0.0.0/0◦ Domain set to Subnet◦ Value set to an absolute amount, not a percentage◦ Decoder set to IP● SNMP Polling – Polling is the process of sending SNMP requests periodically to retrieve up-to-date information. While a low polling interval provides more granular reports, it can increase load if many interfaces are monitored. The default interval is 1 minute• Timeout (ms) – The amount of time (in milliseconds) to wait for an SNMP reply before considering the request failed. The default is 1 second• Retries – The number of times the SNMP Sensor resends a request if there’s no response within the specified timeout. The default is 2● SNMP Protocol – Determines how the SNMP Sensor authenticates:▪ SNMP version 1 – Simple setup (plaintext community) with only 32-bit counters and minimal security▪ SNMP version 2c – Same as version 1 but supports 64-bit counters, essential for gigabit interfaces▪ SNMP version 3 – Adds encryption and authentication to the 64-bit counters from version 2. More secure but also more complex to set up than a simple community string● Community String – A shared “password” for SNMP v1 and v2c. The device authenticates by matching this string to the SNMP community stored in its MIB● Security Level & Name – SNMP v3 only. SNMP Sensor supports the following security levels from the USM MIB (RFC 2574):▪ noAuthnoPriv – No authentication, no privacy▪ authNoPriv – Authentication only, no privacy▪ authPriv – Authentication plus privacy● Auth. Protocol & Passphrase – SNMP v3 only. Choose MD5 or SHA for authentication. SHA is generally more secure● Privacy Protocol & Passphrase – SNMP v3 only. Specifies whether messages are encrypted and, if so, which protocol is used (DES or AES). AES is recommended for modern systems, as DES may be unsupported or disabled● Monitored Interfaces – This grid shows which interfaces will be monitored. For accurate data (no mirrored graphs), add only upstream interfaces. Each monitored interface is defined by the following parameters:▪ SNMP Index – Each interface is identified by a unique SNMP index▪ Interface Name – A short descriptive label for the monitored interface. Note that names longer than ten characters may clutter some reports▪ Interface Color – The color used in graphs for this interface. By default, it’s random, but you can change it from the drop-down menu▪ Traffic Direction – Describes how traffic entering the interface relates to your network:◦ Unset – Treat inbound traffic as “downstream,” outbound traffic as “upstream”◦ Upstream – For external-facing or peering interfaces (e.g., connected to the Internet)◦ Downstream – For customer or internal backbone interfaces◦ Null – Traffic to Null interfaces is ignored▪ Link Speed In & Link Speed Out – Enter the interface’s speed (bandwidth, capacity)● Comments – Use this field to record notes about the SNMP Sensor. These entries are for internal reference only and are not visible elsewhere
To start the SNMP Sensor, click the on/off switch next to its name in Configuration » Components. Watch the event log to confirm it starts successfully. If traffic values in Reports » Devices » Overview remain incorrect after about 5 minutes, follow the troubleshooting steps below.
18.1. SNMP Sensor Troubleshooting
License key not compatible with the existing server in the event log, it means the server is unregistered. Send the Hardware Key (found in Configuration » Servers » [Server]) to <sales@andrisoft.com>[root@localhost ~]# snmpwalk -c <community> -v2c <router_ip> 1
